


Research log, September 2026. It covers every test from 1 to 30 September. Nothing ran from 1 to 8 September, because the nightly data chain was down (incidents, at the end).
This log lists every test I ran in September and how each one came out. This first issue of the Research Log is free in full, so you can see what a paid subscription gets each month. From the October issue on, the verdicts stay free and the designs, tables and intervals behind them are for paid subscribers.
September was the month the program stopped asking whether Lookout can rank stocks (it can) and started asking where the money goes when it trades them. The answer was the fills. The same month, Ballast, the daily allocator, failed the test that decided its future.
An audit of my August claims. Of eight claims re-derived from the raw evidence, one held as worded. The numbers reproduced in seven of eight; the wording and the paper trail did not.
A risk control for the earlier daily network. It failed its volatility rule, passed after two fixes, and paid for both with a lower Sharpe, mostly by holding more cash.
Corrupted training days. 38 of 427 stored days of feature data had been damaged by a nightly automation job. Retraining on the repaired days moved Lookout’s precision by less than the bar I set in advance, so the served networks stayed. (Note, I found it interesting that you don’t need flawless data for precision. There’s some resilience to my model)
Ballast’s full-history test. FAIL. Over 780 trading days its Sharpe after costs was 0.16, against 0.95 for an equal-weight basket and 1.26 for an S&P 500 index fund. It held 42 percent of the account in cash on an average day.
Where the paper bot’s money went. The leak is the price paid to get in. A round trip cost about 142 basis points of the money traded, against an edge of about 16 basis points per graded flag.
Price bands on the Tape. Through 25 September the Tape was positive only on stocks under $1, and the paper bot lost money in every band. You can see my daily progress at The Graded Tape, which is always open and free.
The re-aim of Lookout. Adopted 27 September: retrain Lookout on a cost-aware target and test one trading protocol over the full history.
Would a real-time data feed help? No. None of 16 tested combinations made money, and a faster feed made the result slightly worse. Limit orders beat market orders by about 74 basis points per flag.
Three look-ahead leaks. Confirmed in the data, then knocked out of the live model one at a time. None of them moved the ensemble’s precision by more than 0.0015. Again, good demonstration of model resilience.
An outside review of my plan. Five Opus 5.5 reviewers scored my 4.8 out of 10: strong on methodology, weak on any route to money.
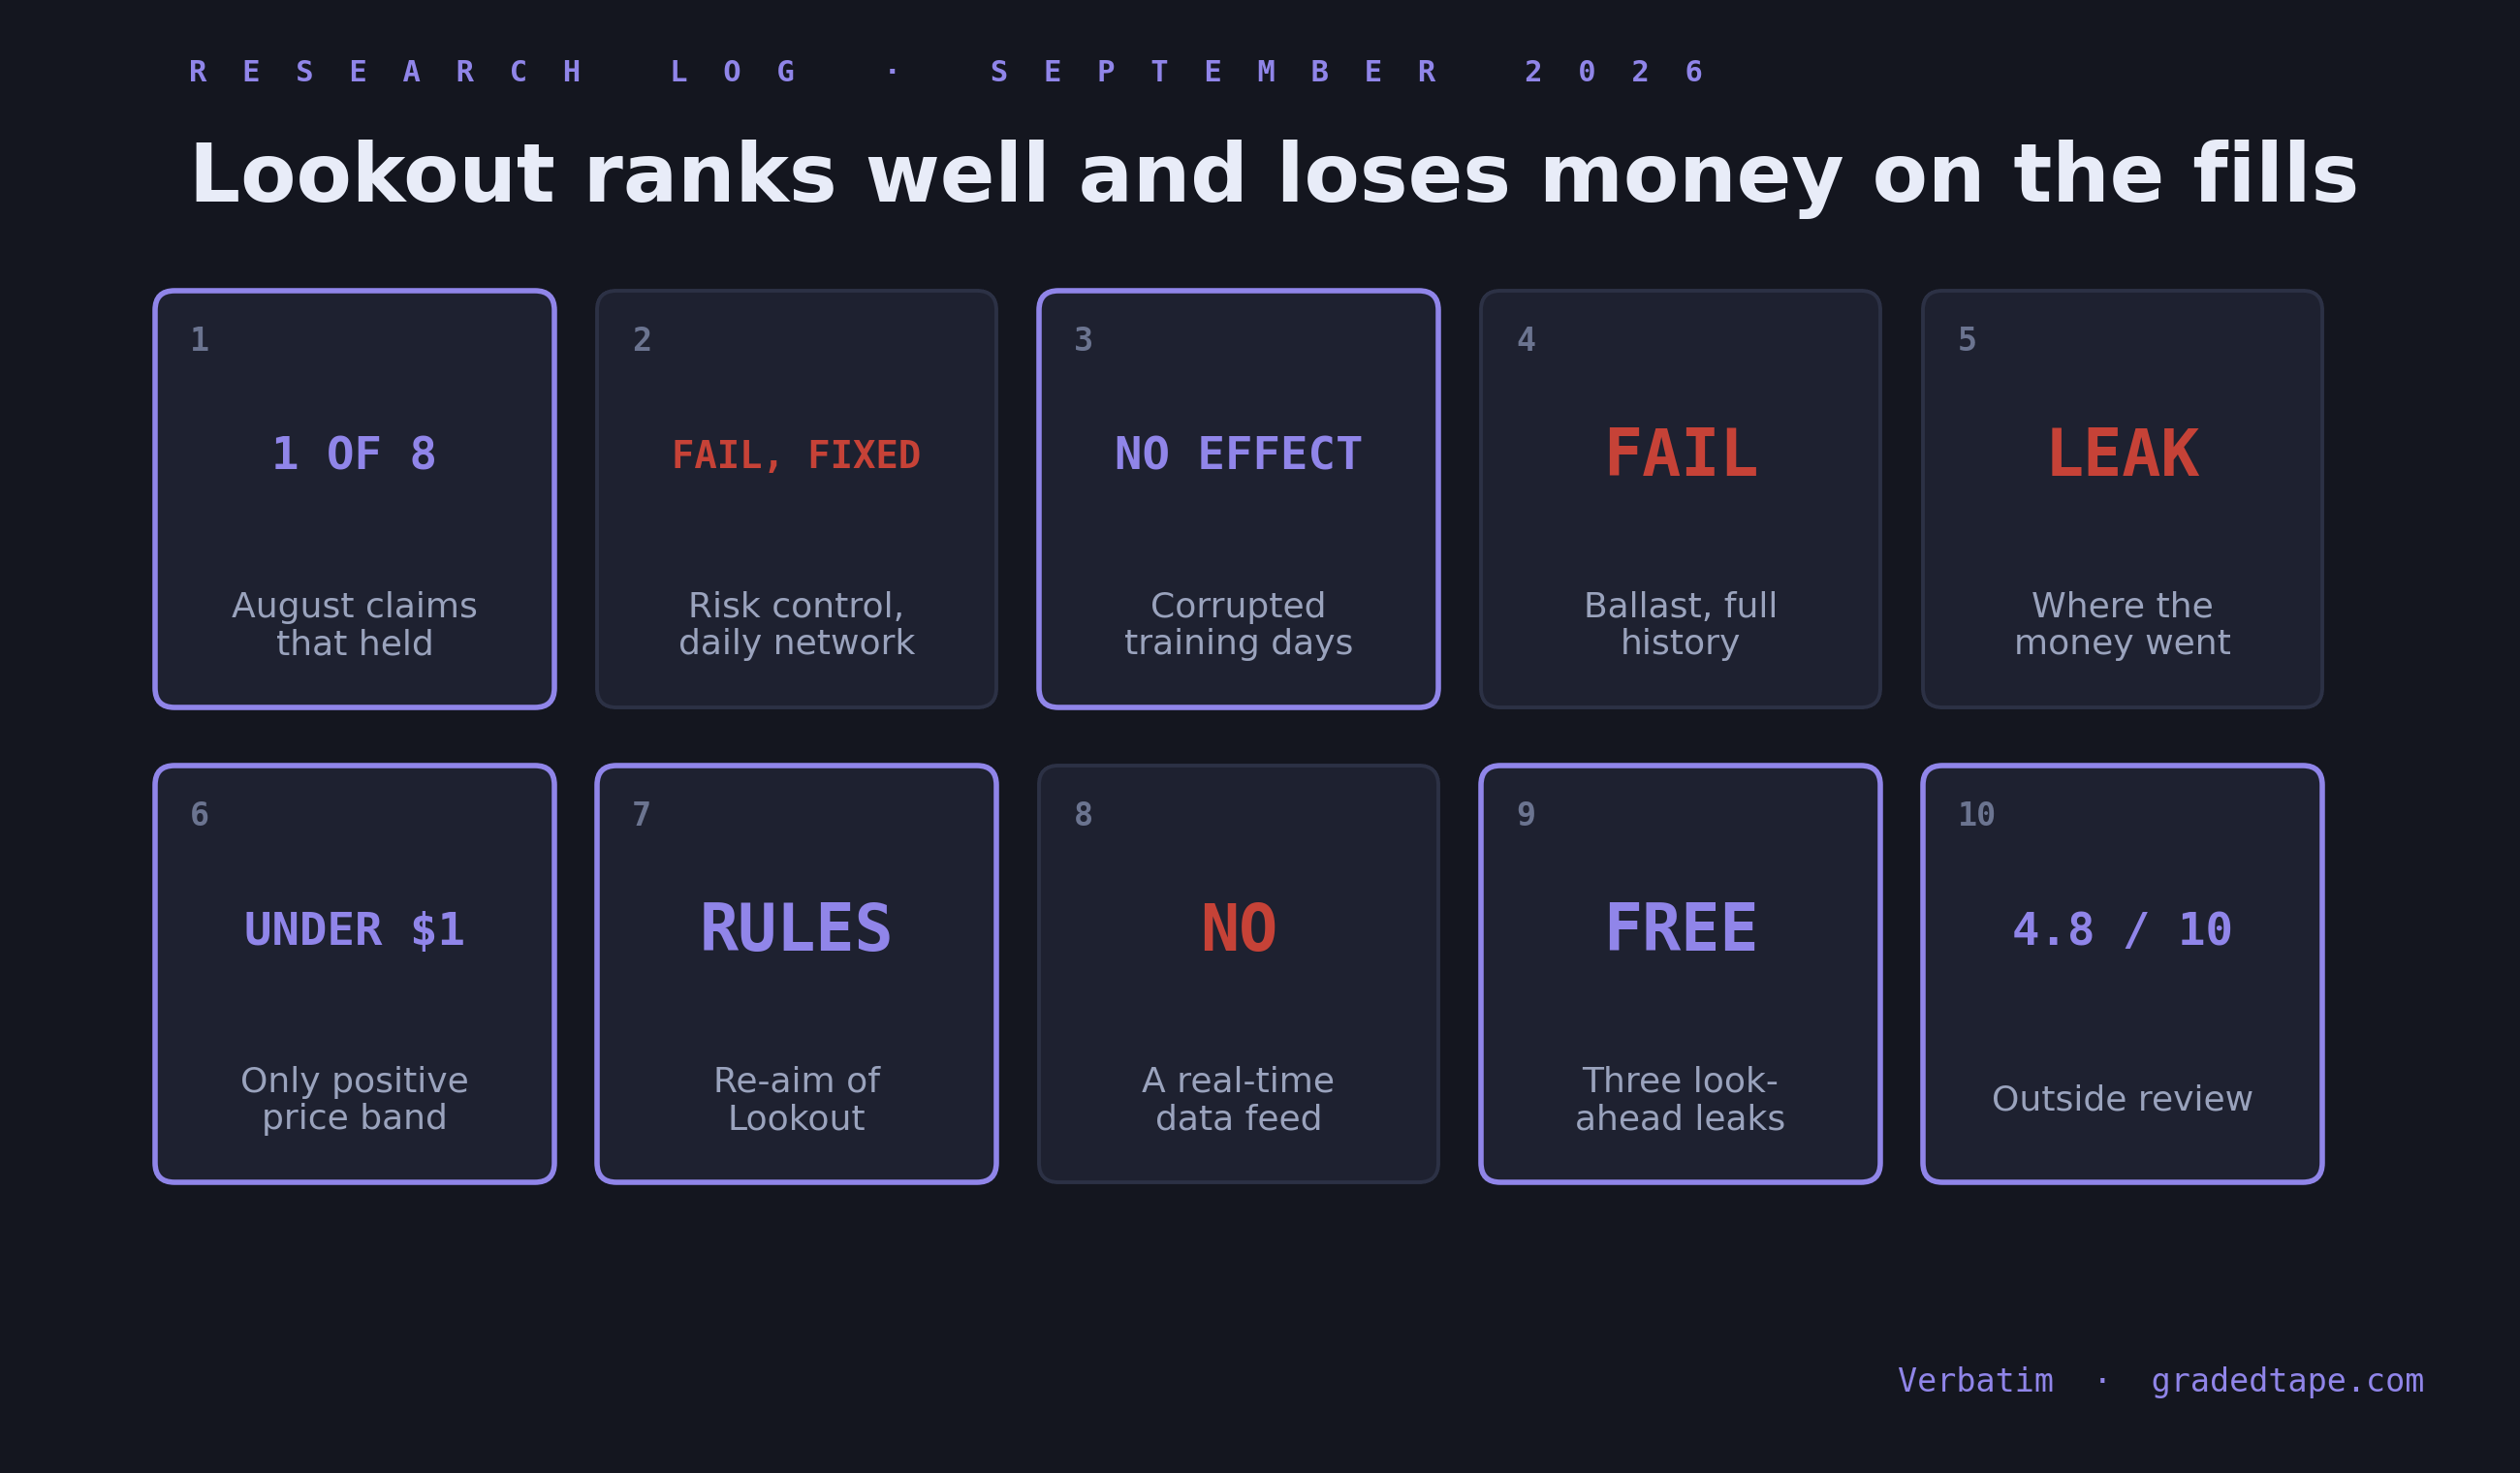
What September changed is the question I was pursuing. Every result above says Lookout’s ranking is real, but my way of trading it is lacking. Below, each entry gets its design, its tables and intervals, and what it led to.
The research log, September 2026
How to read this log
Every test here was judged by a rule written down before its result existed.
Let me start with a vocab glossary:
Sharpe is return per unit of volatility.
Maximum drawdown is the worst fall from a peak.
Precision at a 1 percent false-positive budget is Lookout’s score, the share of its most confident flags that make the move.
A basis point is a hundredth of a percent.
A 95 percent interval comes from resampling the results. A result counts only when its interval clears zero.
Walk-forward means every decision uses only data from before it.
The deflated Sharpe ratio charges a Sharpe for every trial run before it.
In September the reads still used Sharpe after costs as their main bar. The program’s current criterion, “active dollars against an index fund at four test account sizes,” was set on 13 October, so the October log uses it and this research log post mostly does not.
1. The audit of my August claims (read 9 September)
The question. By the end of August I had eight claims the program leaned on, from “the allocator sweep found no skill” to “the Tape is graded with no manual edits”. Do they hold when someone else re-derives each one from the raw evidence?
How it was tested.
One reviewer per claim assembled the evidence.
Three more tried to refute it from three angles: the arithmetic, whether the data was available at the time it was used, and whether production matched the claim.
They were told to rule “refuted” whenever a claim could not be checked.
A vote to uphold counted only if it cited evidence beyond what the first reviewer found.
The verdict. One claim confirmed as worded, seven refuted as worded.
The numbers.
The confirmed claim was the August allocator sweep’s no-skill reading, re-run at SPA p-values of 0.957, 0.943 and 1.000.
In seven of the eight claims the headline numbers reproduced from raw data. What failed was the paper trail, the match to production, or the wording.
The earlier daily network’s August “pass” rested on a preregistration that had never been frozen. Scored strictly, its volatility rule failed, with one seed over the bar on 23 percent of days against an allowed 10.
The Tape’s page said “manual edits none, ever”, while sessions had been regraded offline after a grading incident. On 10 September the page was corrected to “27 sessions regraded offline on Aug 21, 2026; no manual edits since”.
That day the Tape read 33 sessions, 6,336 graded, 33.3 percent and -$1,159.21 at fixed paper sizes, checked to the cent against 49 morning reports.
The lesson. A number can reproduce while the claim built on it is still wrong. I now check every claim three ways: the number, where it came from, and the words around it. This is mostly semantics, but if I’m building in public and highlighting my transparency as a perk of this Substack, I may as well share.
2. A risk control for the earlier daily network (9 to 27 September)
The question. Before Swell (another one of my model designs) took its current form, the daily model was a network that wrote a portfolio directly, and its training kept drifting toward an all-cash book. Could a redesigned training objective keep it invested while holding its volatility inside a set band? This was a condition for renting a GPU day for a larger sweep. It was not a money test.
How it was tested.
One configuration, four monthly retrains in mid-2024, 87 trading days served, three seeds.
A served day counted as over the band if its volatility ran more than 5 percent above the target.
More than 10 percent of days over failed the read.
Sharpe here is after costs, on the portfolio’s weights, over those 87 days.
The verdicts, in order.
9 September, a clean re-run from committed code. FAIL. One seed ran over the band on 20 of 87 days.
9 to 10 September, a 314-day check of the larger sweep’s exact command. Realized volatility ran at more than twice the target, with 197 of 314 days over. The problem was in the design, not in one seed.
10 September, fix one. A hard cap scales the book down whenever its volatility exceeds the target. PASS, with no seed over on any day. The median Sharpe fell from 1.02 to 0.80.
27 September, fix two. Training that is aware of the volatility band, scored on runs made 10 September. PASS, with the hard cap needed on only 2 or 3 of 87 days per seed. The median Sharpe fell again, to 0.47. Its own verdict says volatility fell “mainly” through holding more cash.
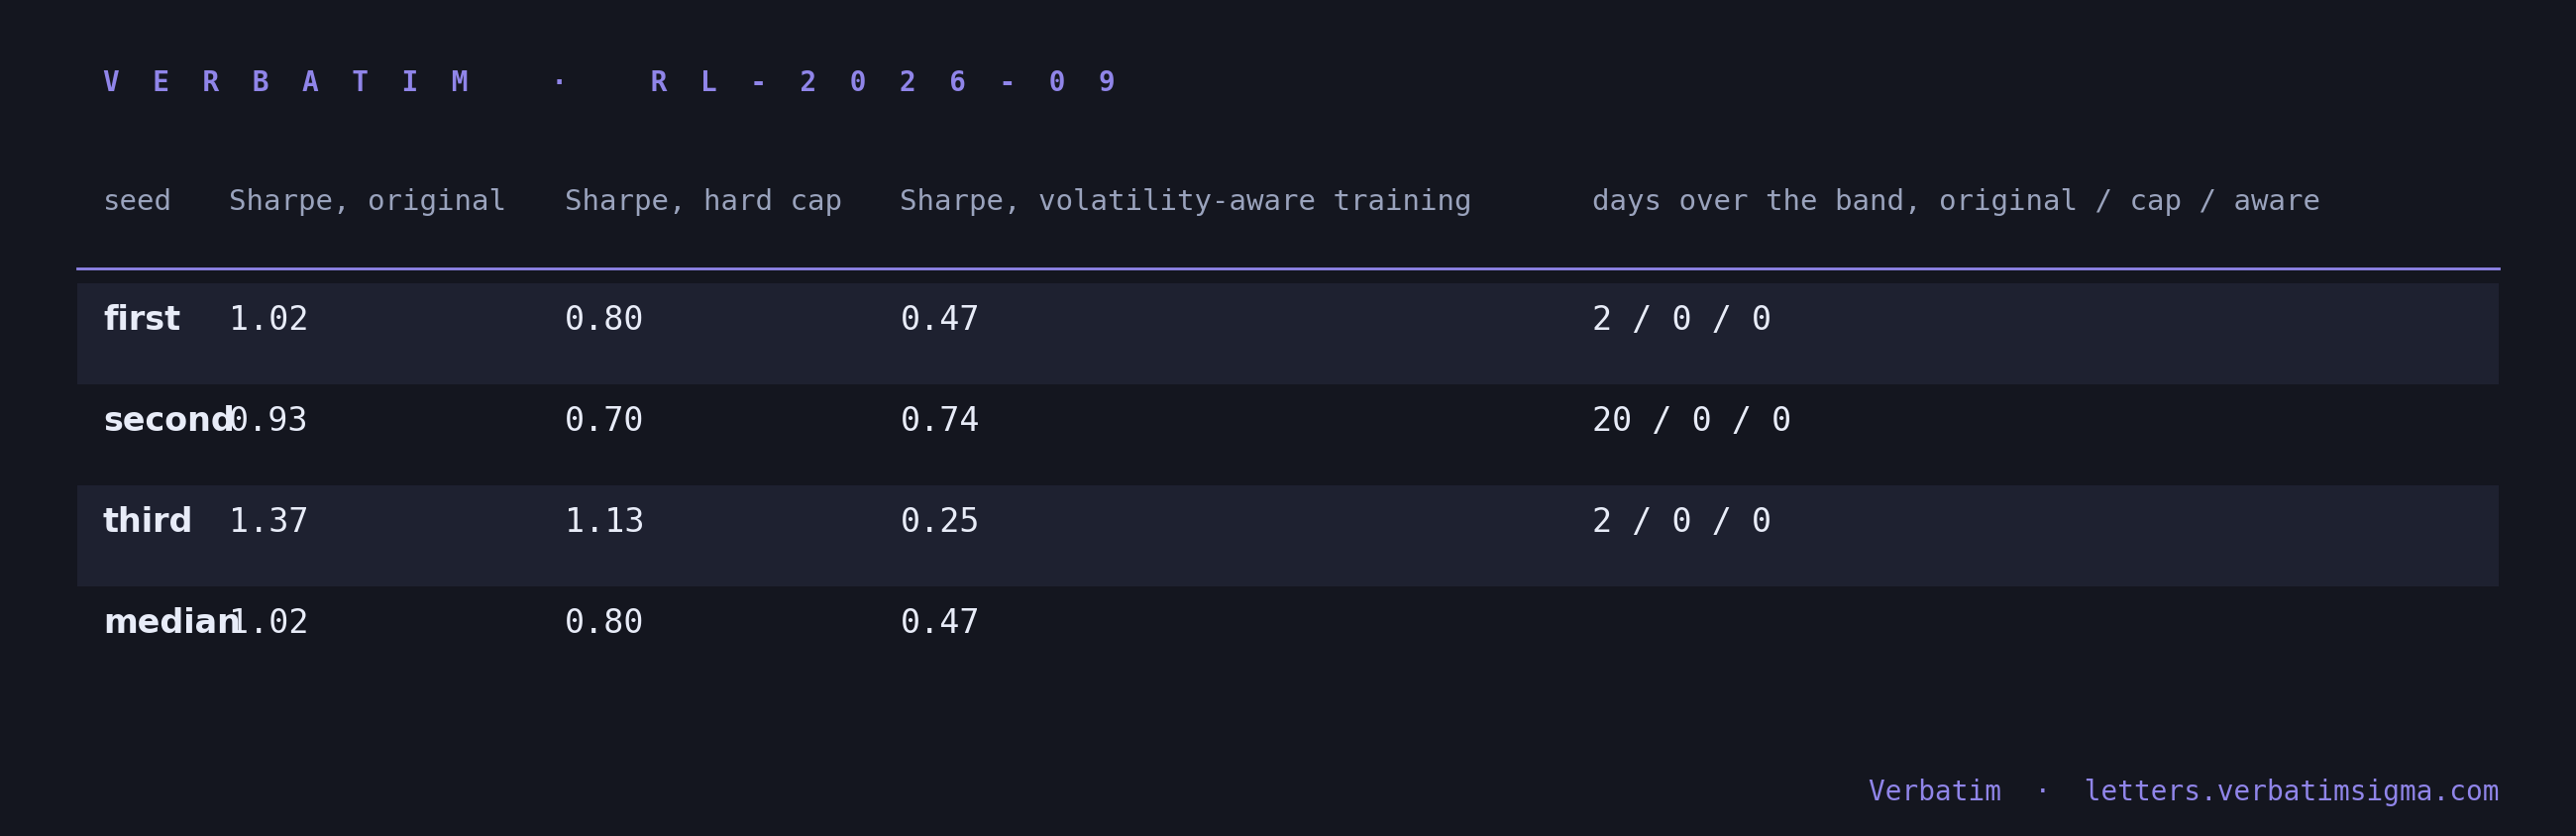
What followed. The larger sweep was amended and staged, and never ran. The line folded into Swell’s October work.
The lesson. A volatility target that lives only in the training objective is not enforced. Once it was enforced, the network met it by holding cash, the same habit that sank Ballast in entry 4.
3. Corrupted training days (found 17 September, replayed 18 to 19 September, corrected 28 September)
The question. An audit of the feature pipeline on 17 September found that the nightly job had been damaging one group of overnight and prior-day features. Lookout’s networks had trained on the damaged days. Did that make them worse?
What went wrong.
Every night the job rebuilds its twelve most recent dates. It zero-filled that feature group for the oldest of the twelve and wrote the damaged day over the stored one.
38 of 427 stored days were affected, across late March, July to mid-August and late August.
The fix went in that evening and was proven on data the same night. The damaged dates were rebuilt.
How it was tested.
Each of Lookout’s four networks was retrained on the repaired data over 66 walk-forward windows and compared with the served version, window by window.
The rule was set before the replay ran. A mean change in precision under 0.01 means no material effect. Over 0.02 means swapping in the retrained networks.
The verdict. No material effect, so no swap. Model design is resilient.
The numbers.
On 28 September I found that the replay’s starting point had already trained on the test days of its first 15 windows, so the read uses the 51 windows after them.
On those 51 windows the retrained networks scored lower than the served ones by 0.0062 [0.0021 to 0.0102], 0.0063 [0.0029 to 0.0097], 0.0091 [0.0056 to 0.0127] and 0.0050 [0.0014 to 0.0085].
Every difference sits under the 0.01 line, so the verdict held.
The replay is not a pure test of the corruption, because the retrained networks also differed from the served ones in other ways.
The lesson. A job that rewrites stored history needs a check that what it wrote is plausible. The damaged days showed one feature value on every row, against about 0.05 percent of rows on a healthy day, and nothing was checking for it.
4. Ballast’s full-history test (run 10 September, read 27 September)
The question. Ballast is a daily allocator, a forecaster feeding an optimizer that sets position sizes. It had passed its earlier gates on the period it was chosen on. Over every day it could be tested on, did it beat holding an S&P 500 index fund and an equal-weight basket of its own stocks, after costs? On 10 September I replaced a planned wait for live results with this walk, because the walk could answer the question now.
How it was tested.
The frozen candidate was walked over 780 trading days, 1 August 2023 to 9 September 2026.
38 monthly retrains, with a seven-day gap between training and trading.
Costs came from spreads. Whole shares in a small account, long only plus cash.
The bar, written before the walk, was a net Sharpe at 1x costs strictly above both baselines.
The deflated Sharpe ratio was reported but not part of the bar.
A third arm, the same optimizer fed trailing-average returns in place of the forecaster, is shown for reference.
The verdict. FAIL. Ballast was parked as an allocator model. It still runs every night on paper as a check, and an extended read runs once December’s data exists, or if I feel like restarting it sooner.
The numbers.
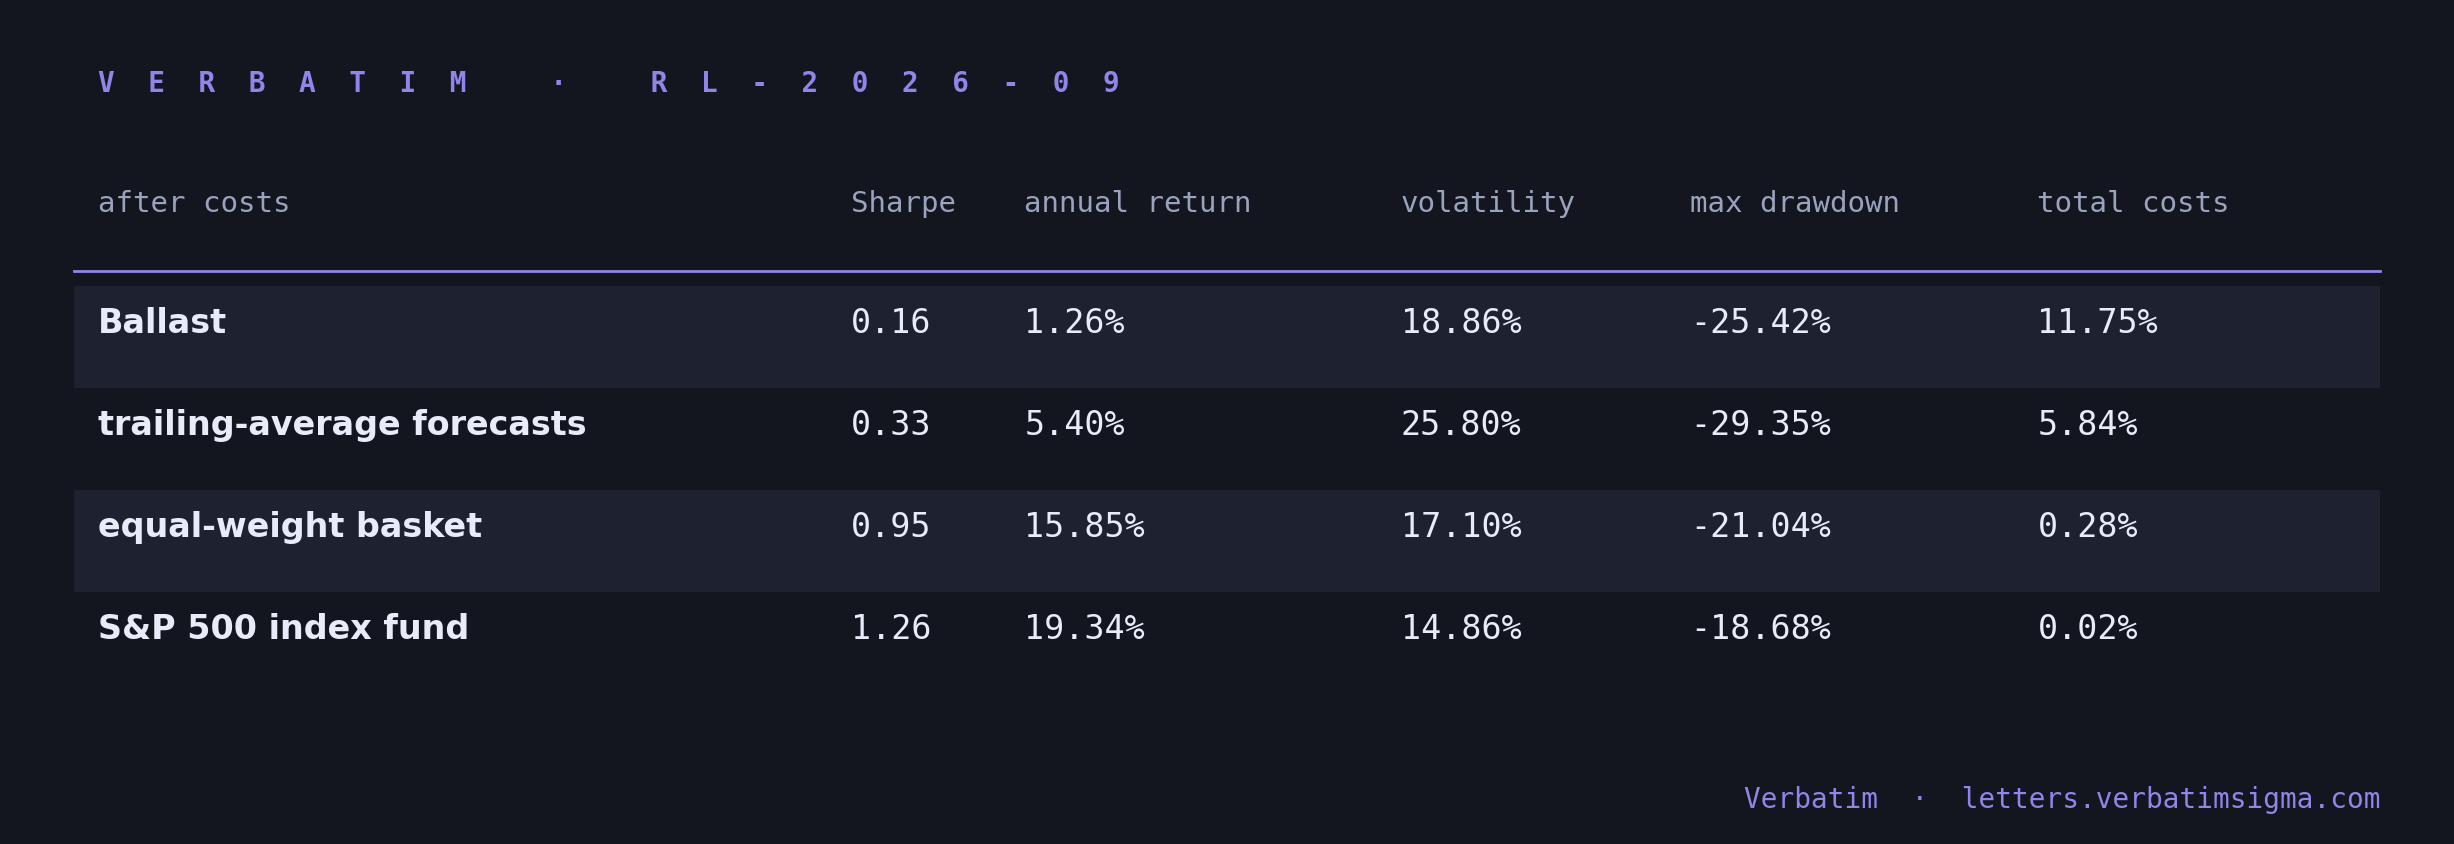
Sharpe margin against the equal-weight basket: -0.79, with a 95 percent interval of -1.74 to +0.12.
Sharpe margin against the index fund: -1.10, interval -2.18 to -0.04.
Deflated Sharpe ratio: 0.13.
Year by year, Ballast trailed the index fund in every year of the walk.
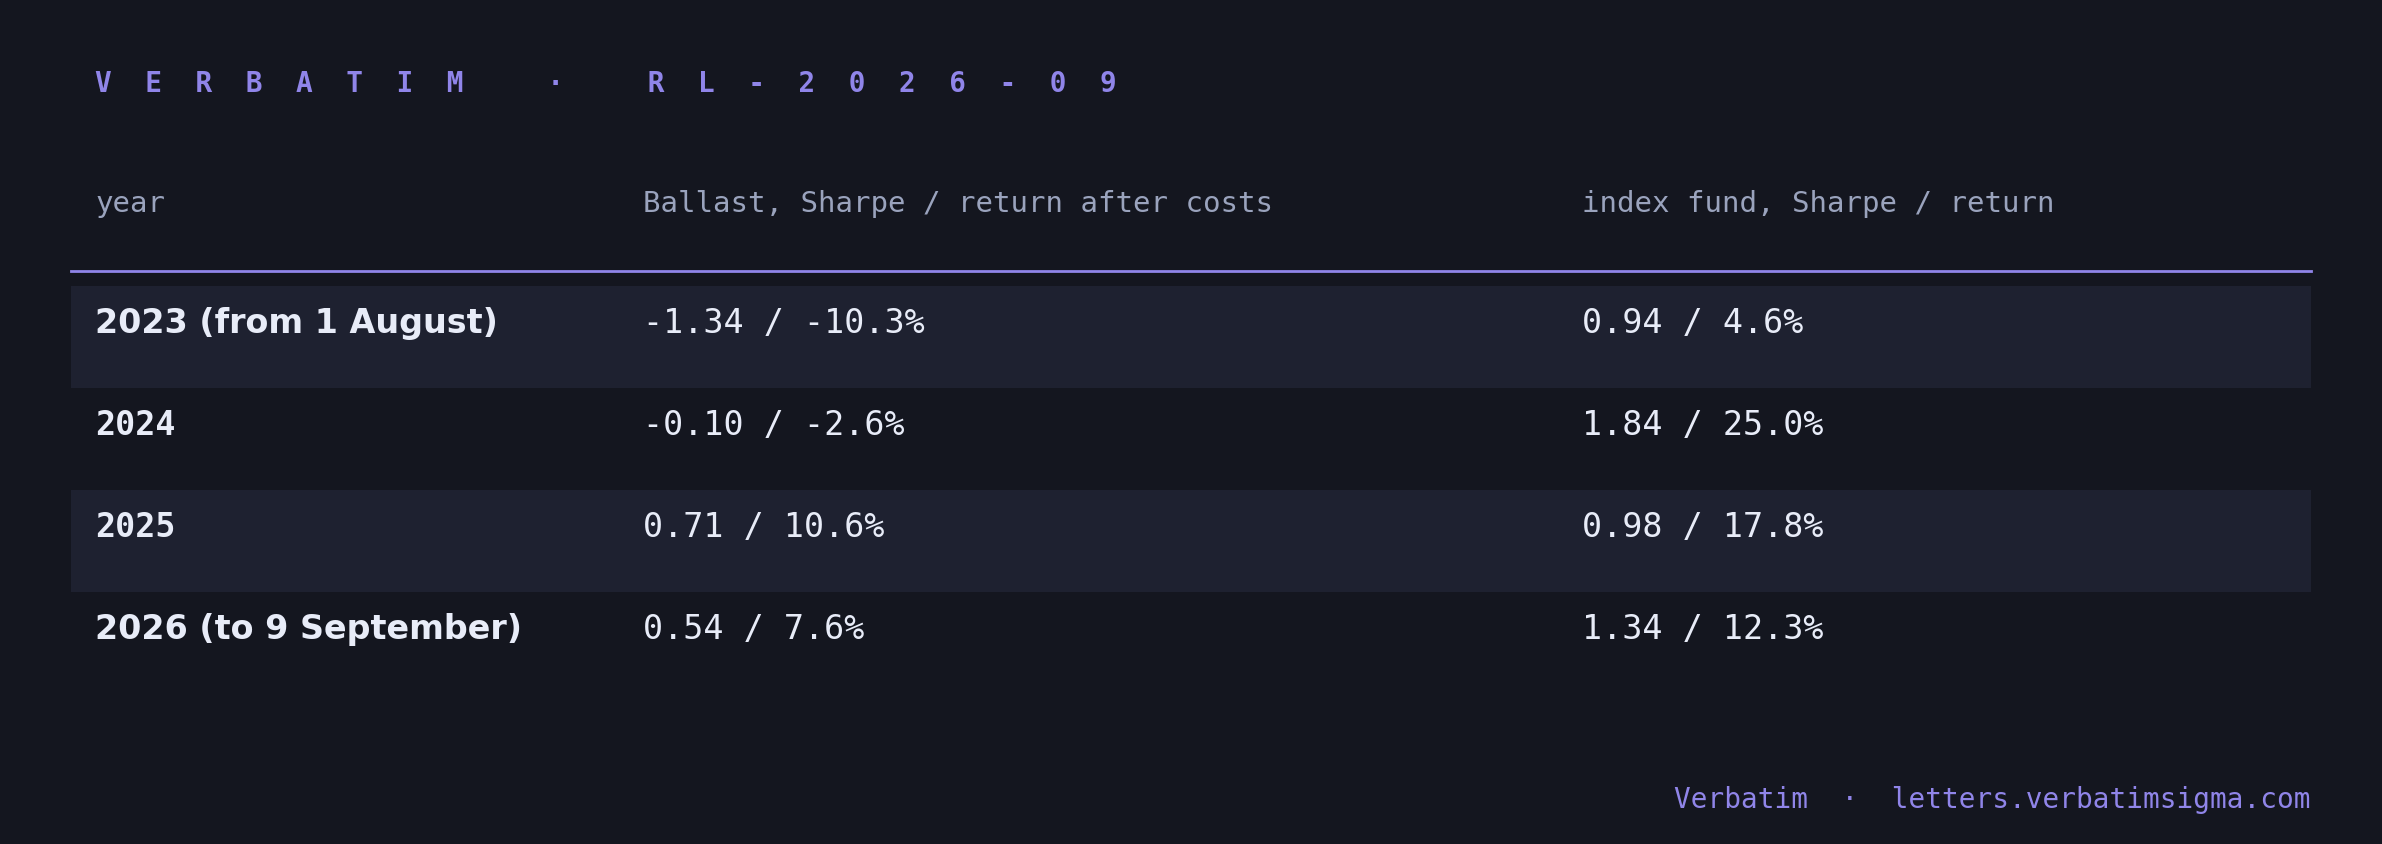
On the span its earlier gates used, July 2024 to June 2026, Ballast read 1.10, against 1.07 for the basket and 1.11 for the index fund. Its earlier pass came from the period it was chosen on.
Why it lost. A diagnosis split the gap into parts, with its reading rule frozen before any number was computed.
Cash was the largest part. Ballast was 57.6 percent invested on an average day, so 42.4 percent of the account sat in cash earning nothing.
Cash cost it 11.09 percent a year against the basket (interval -21.32 to -0.93) and 11.97 percent a year against the index fund (interval -21.11 to -3.37).
Costs came next, about a quarter of the Sharpe gap to the basket.
Cash and costs were the only parts whose intervals excluded zero.
The forecasts showed no measurable skill. Their daily rank correlation with what happened was +0.0104, interval -0.0039 to +0.0252.
The lesson. A portfolio that holds 42 percent cash cannot keep up with an index fund that is always fully invested, and a forecast with no measurable skill gives the optimizer no reason to hold more stock. Both findings went into the criterion the program uses now, which judges every book against an index fund held in the same account.
5. Where the paper bot’s money went (frozen and read 27 September)
The question. Lookout’s paper bot trades its flags on the broker’s paper simulator. Over its first eleven sessions after it resumed (11 to 25 September, 535 filled lots), the Tape’s grade of those flags was positive but within noise, and the bot lost money. Where does the money go between the flag and the fill?
How it was tested.
Each lot’s result was split exactly into four parts: which flags it picked and when it entered, the exit rule, the price paid to enter, and the price received on exit.
Intervals came from resampling whole sessions 10,000 times.
The reading rule, frozen before computing, called a part a leak only if it was negative and its 95 percent interval excluded zero.
It was a reading of the evidence, not a pass or fail, and it changed no trading rule.
The verdict. “Most of the money leaks in the price the bot pays to get in and out, not in which flags it picks, when it enters, or how it exits.” The entry fill was the only part that met the leak rule.
The numbers, in basis points of the money traded.
Entering cost about 102 and exiting about 40, a round trip of about 142.
The Tape’s edge was about 16 basis points per graded flag, so the round trip cost six to nine times the edge.
A check added after the fact found 351 of 1,070 fills priced outside the range printed in their minute, or in a minute with no print at all. Moving every such fill inside the printed range still left a round trip of about 90.
Entry timing and the exit rule both came out positive and unresolved.
An independent check recomputed all 535 lots from the raw inputs with its own code and found no disagreements.
The bot made money in 2 of its 14 September sessions.
The lesson. An edge of 16 basis points per flag does not survive a round trip of 90 to 142. No exit rule changes that, because the exits were not the problem.
6. Price bands on the Tape (read 27 September)
The question. Lookout’s precision is much higher on low-priced stocks (arc one covers why). Does the Tape’s money follow?
How it was tested.
The Tape’s own grading, grouped by share price, over every graded session from 14 July to 25 September.
The Tape grades at fixed paper sizes, before trading costs.
I reproduced the table exactly from the archived morning reports with the Tape’s own code.
The numbers. 45 graded sessions, 8,506 graded signals, -$822.78 in all.
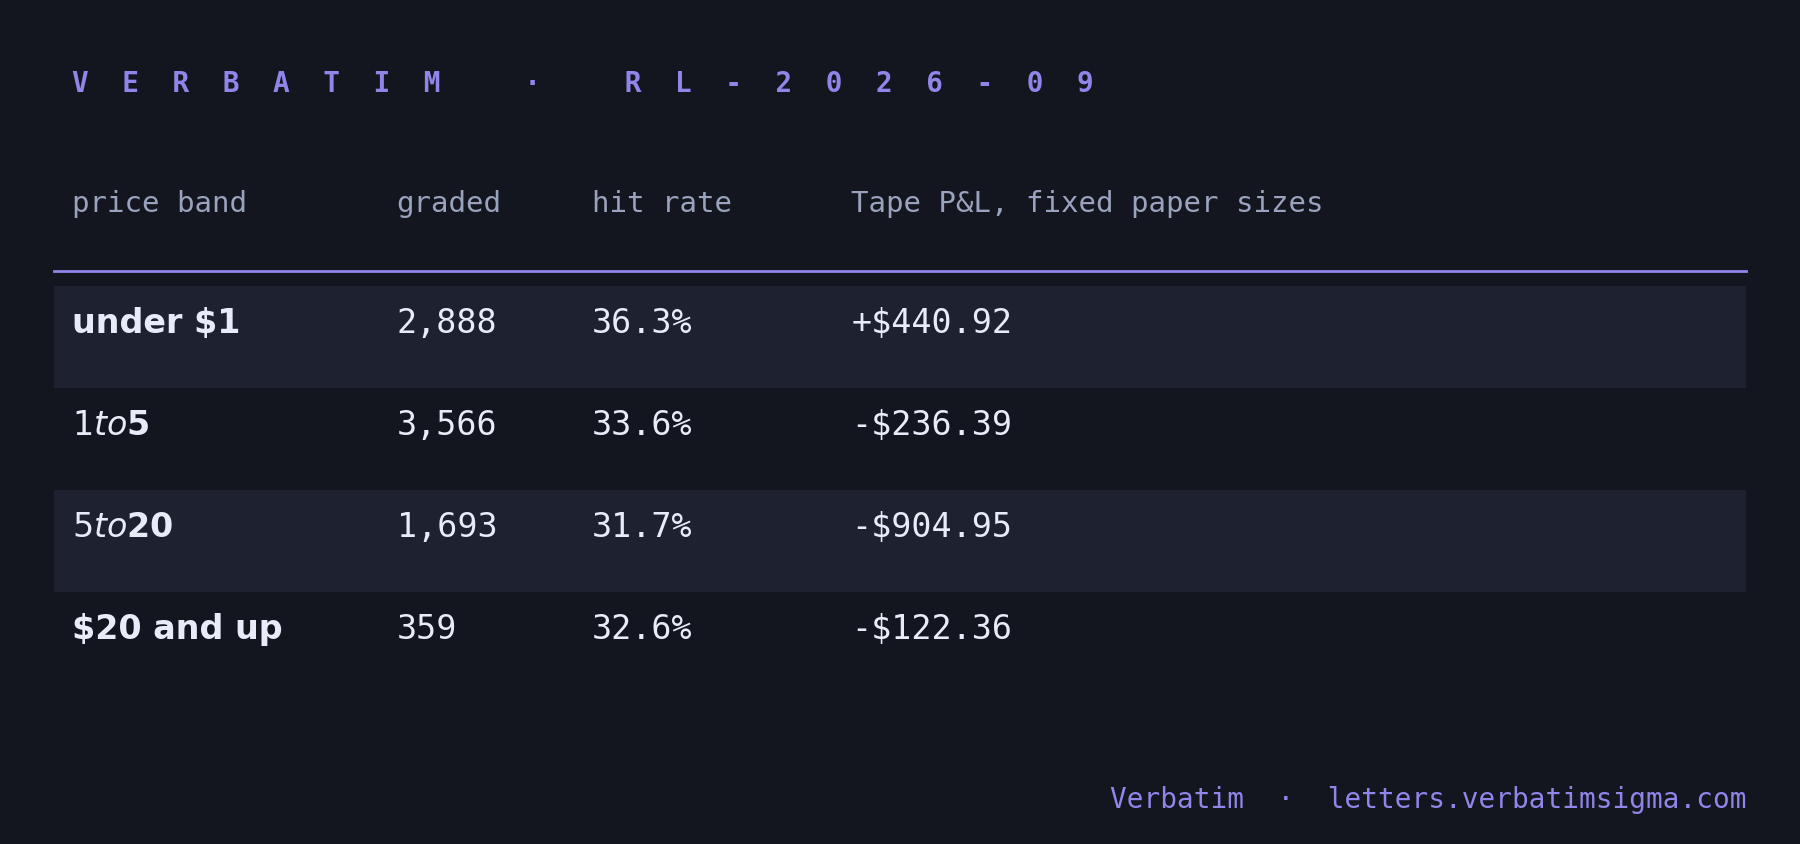
The paper bot lost money in every one of its own price bands over the same eleven sessions as entry 5.
What followed.
I kept the bot’s universe as it was. Price and liquidity floors became tested arms of the re-aim walk rather than live limits.
On the live Tape through 16 October, the under-$1 band stood at +$57.33 on 3,964 graded, so most of its September gain had gone.
The lesson. The one positive band is positive before costs, and entry 5 shows what costs do to an edge this size. A band that was ahead in September and nearly flat a month later is not a result to trade on.
7. The re-aim of Lookout (proposed 18 September, adopted 27 September, amended 30 September)
This entry is a change of plan, not a test.
Where things stood. Lookout’s ranking skill was well measured, with precision near 36 percent at a 1 percent false-positive budget against a base rate of about 1.3 percent. No trading protocol had made money on the vendor’s bars.
The plan, in three working steps.
Make the live model match the tested one.
Retrain Lookout on a target that subtracts the cost of getting in, judged against the current target.
Walk one preregistered trading protocol over the full history. It passes only if it is positive after costs with its interval clear of zero. Otherwise Lookout is a ranking instrument and not yet a trading one.
Set on 30 September, after the outside review in entry 10.
The trial count the read would be charged for: twelve.
The walk’s start: 3 January 2023.
The consequence of a fail, written down in advance. Lookout’s paper bot stays a measurement, and Lookout’s scores become a candidate input for the daily model.
The same night I ruled that the public record would stay private until a Lookout protocol made money. I reversed that on 18 October and published everything, losses included.
What happened. The re-aim was frozen on 7 October and read on 10 October. Both steps failed. The October log has the full result.
8. Would a real-time data feed help? (frozen and read 28 September)
The question. The live chain works from data delayed by a median of 17 minutes. If Lookout’s flags are right but arrive too late, how much would a real-time feed recover?
How it was tested.
45 sessions from 14 July to 25 September, 14,002 flags, 8,460 of them graded in common.
Each flag was re-traded at delays of 17, 5, 2 and 1 minutes.
Two order types, a market order or a limit order just below the prior close, at the costs measured in entry 5.
The rule, frozen before any number existed, said a real-time plan was worth pricing only if at least one of 16 decision cells (four price bands, two short delays, two order types) came out positive by the interval rule.
The verdict. The rule did not fire. 0 of 16 cells positive, 12 negative, 4 unresolved.
The numbers.
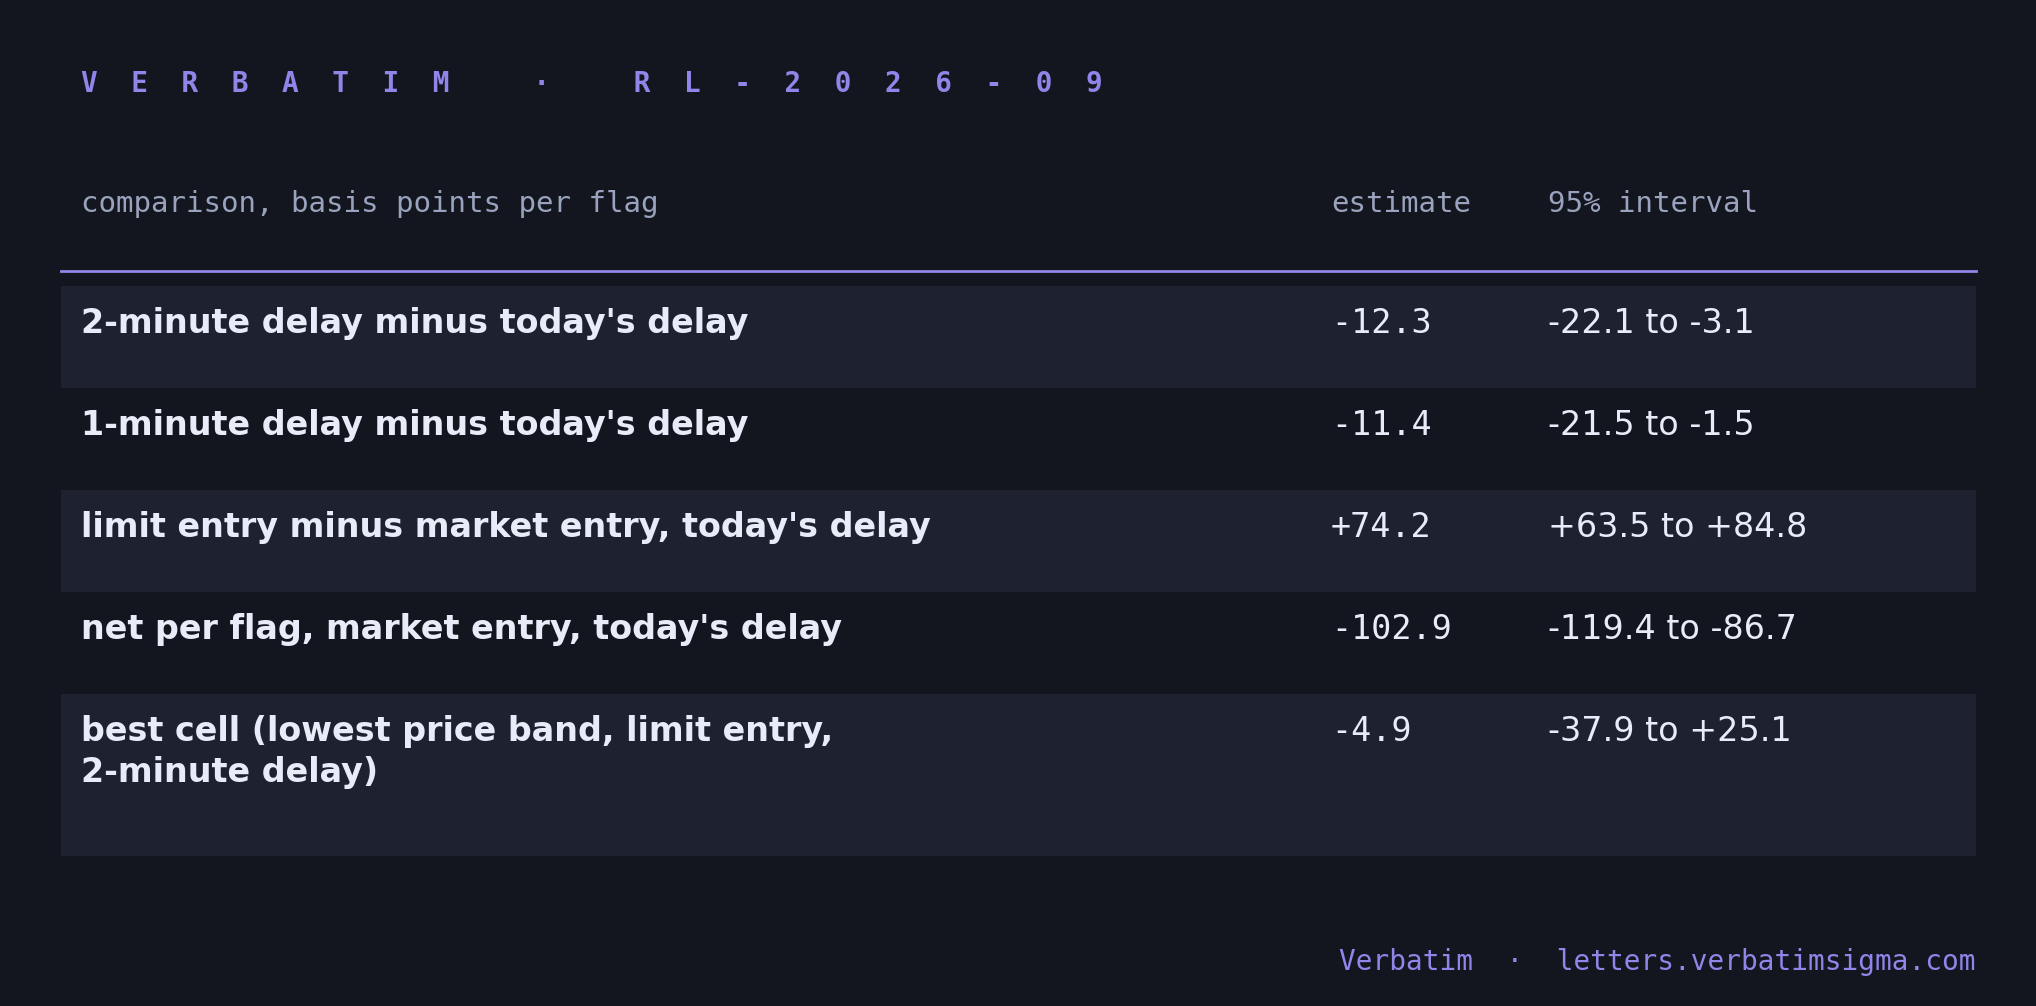
A faster feed made the result slightly worse before costs.
The order type was worth about six times any change in speed.
The limit-order fill model is optimistic, so the limit numbers are a best case.
The Tape’s published rows were reproduced, 3,667 of 3,667 on 12 sessions, and a second reviewer hand-checked 80 random flags.
What followed. No real-time feed was bought, and the re-aim walk added limit-entry arms.
The lesson. Arriving earlier does not help when the cost of getting in is the problem. The cheapest improvement in this test was the order type, and even the best cell did not clear zero.
9. Three look-ahead leaks (confirmed 18 September, knocked out 28 September, read 30 September)
The question. The pipeline audit found three ways future information reached Lookout’s inputs, and two reviewers confirmed all three on the data. How much does the served ensemble lean on them?
The three leaks.
Two company-description inputs were taken as of the run date and copied onto every past date.
Some inputs were computed from the whole trading day, including bars after the one being scored.
One input was built from filings dated after the bar.
How it was tested.
On the frozen networks, each group’s values were overwritten with a neutral value at scoring time.
37 windows, with paired resampling 10,000 times.
The rule, set before the read, called a group free under a 0.01 change in the ensemble’s precision, and ordered a retrain over 0.02.
The verdict. All three free.
The numbers, change in the ensemble’s precision.
Company-description pair: +0.0001 (interval -0.0012 to +0.0012).
Whole-day inputs: +0.0015 (-0.0004 to +0.0037).
Filing-date input: +0.0001 (-0.0004 to +0.0006).
Single networks moved more than the ensemble did.
What followed. All three groups were dropped from the re-aim’s training anyway, since there was no reason to keep inputs that cannot exist at the time of the trade.
The lesson. A leak can be real and harmless at the same time. The knockout measured the harm before I paid for a retrain.
10. An outside review of the plan (30 September)
The question. Is the plan the right path to the goal, and is the change I proposed that night better?
How it was tested. Five reviewers took one lens each, market microstructure, signal research, validation, live retail trading and a red team. Two refuters cross-examined each reviewer.
The verdict.
The plan scored 4.8 out of 10 (spread 4 to 5), and the proposed change 4.2.
The summary called the program “on the right track in method and direction, and off the shortest path in tempo and odds”.
Measurement discipline scored near 9. The route to money scored 3 to 5.
All twenty of the reviewers’ recommendations were refuted, mostly because they assumed inputs the program does not have.
The point no reviewer disputed was that the program’s checks had removed false edge without creating real edge.
What followed. The full-history start date and the trial count in entry 7, and the advance consequence of a fail.
Incidents
The data chain outage, 30 August to 9 September.
A firmware update on the storage server locked the data folders, and every nightly step after it failed.
The alarm named only the steps that failed downstream, so the cause went unreported for ten days.
The fix made the first step write its own failure flag.
Six live sessions, 31 August, 1 to 4 September and 8 September, have no record on the Tape.
Nothing in this log ran before 9 September.
The corrupted feature days. Entry 3.
What this log does not contain
Feature definitions and counts, score thresholds and universe screen parameters stay private for now. Dollar account sizes and position sizes are never published, so the paper bot’s results are given in basis points of the money traded. Both rules apply to every tier.
Lab notebook, education and research purposes only. Not investment advice, not a solicitation; no advisory relationship is created by reading this. I trade a small account and describe my own process, errors included.