


Written in July 2026. Anything that has changed since then is marked with an October update.
The best finding of the campaign was where my model already works best.
When my founding thesis lost, working out why meant re-scoring the single model, Lookout, started from on different slices of the market. One of those slices scored far higher than I expected.
The split
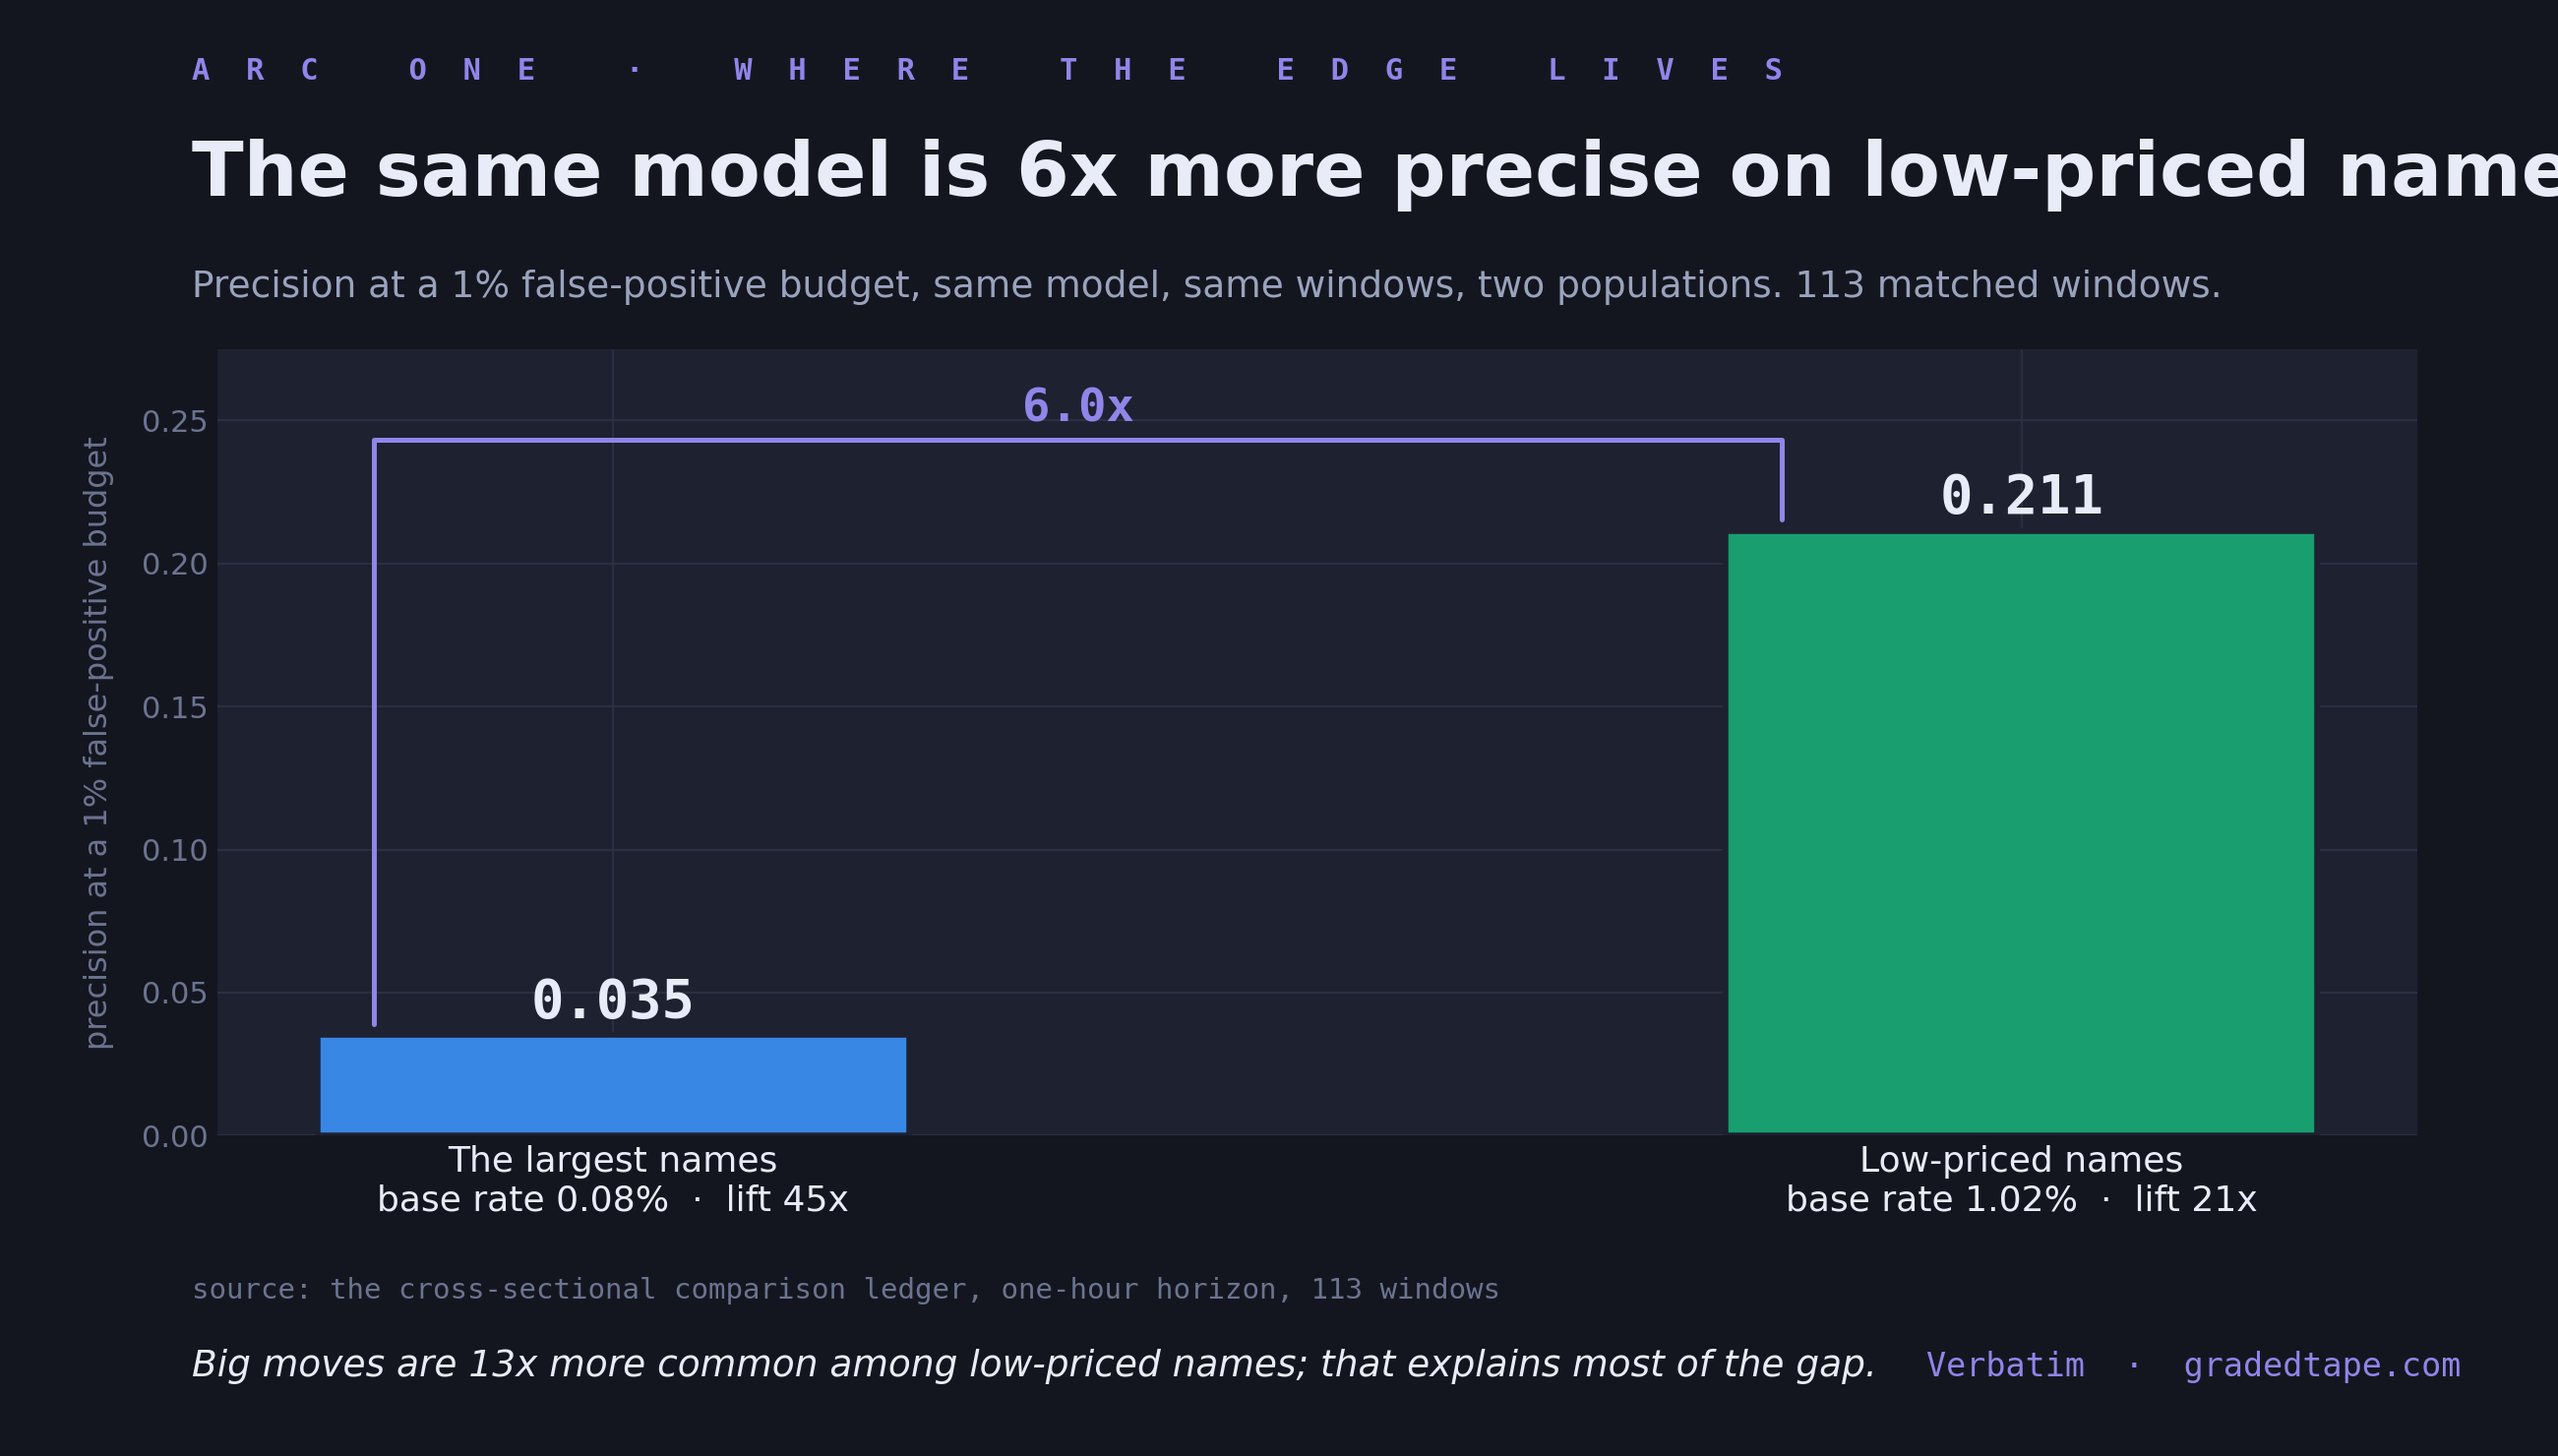
Same model, graded the same way, and it’s roughly six times more precise among low-priced names than among the largest names, where most systematic funds trade. About one low-priced flag in five goes on to make the move.
Base rates first
Low-priced names make large intraday moves far more often than the largest names do. In these same windows, at any given minute, about one low-priced name in a hundred was within an hour of making the move, against fewer than one of the largest names in a thousand, which is roughly thirteen times as many targets. The score holds the false-alarm budget fixed within each slice, so a slice can’t inflate its score just by being noisier, but having more genuine movers to find still helps it a great deal.
Measured against those base rates, the comparison turns around. Relative to how rarely the largest names move, the model’s lift there is the larger one, about forty-five times the base rate, against about twenty-one times among low-priced names. So most of the six-fold gap comes from having more movers to find rather than from a smarter model. Still, more of the low-priced flags you could act on go on to make the move.
Why the opportunity persists
Visible opportunities usually get traded away, so this one needs a reason. My first guess in July was capacity, since big funds can’t trade small names without moving them. That guess doesn’t fit this slice. It’s cut by share price and trading volume, so it holds some of the most heavily traded products in the market, leveraged index funds included. The plainer reason is arithmetic. A five percent move is an ordinary day for a three-dollar stock or a fund built to move three times the index, and a rare one for a giant.
A finding like this still has to survive real costs. Subscribe and watch that measurement happen in public.
What changed
My daily watchlist now defaults to the low-priced end of the market, and I’ve mostly stopped looking at the largest names for now, for this model. I spent most of this campaign trying to make the model smarter. Re-scoring the same model on different slices of the market cost nothing, and it changed my trading more than any of the architecture experiments did.
The caveats
Low-priced names come with wider spreads as a share of the price, uglier fills, and exits that can take patience at the worst possible moments. Some of the paper edge will go to paying those costs. How much is a measurable question, and the live diary later in this series exists to measure it with logged fills. I wrote that into the record on purpose, so you can hold me to it.
October update: no published diary of real fills exists yet, but The Graded Tape has been taking the measurement in public, at fixed paper trade sizes, and so far the low-priced precision has not shown up as money. Through Oct 16, 2026, 60 trading days and 11,316 graded signals, the record stands at -$1,877.13, with 34.0% of signals reaching the Tape’s target.
From arc two onward, the working papers sit below the line for paid subscribers, twenty dollars a month or two hundred a year. The founding tier, four hundred a year, is for readers who want to fund the lab harder, with the rate locked and first claim on anything that opens later, if and when a model passes its sealed test.
If someone you know builds models for their own trading, this is the arc to send them.
The working papers
Below is the paperwork the six posts were written from, so you can check any number in them. Nothing in it revises a verdict.
This appendix is free, and it stays free. From here on every arc closes this way, with the working papers below the line for subscribers, while the verdicts, the hit rates, the misses, and anything else that would change your read on whether this works stay above it permanently.
Appendix: working papers, arc one
Every number below is traced to the document or data file it came out of, and each source is named in plain words below the table it feeds.
1. The decision rule, as pre-registered
As signed, before any result existed.
Dethrone bar: improve mean P@1%FPR by more than +0.02 over the incumbent
Interval: paired bootstrap over per-window differences, 1,000 resamples, fixed seed, 95% interval clear of zero
Tie-break: ties go to the simpler and older model
Evidence freeze: 2026-04-10; windows past it excluded from adjudication
Scored: 793 matched windows, 60 frozen windows excluded
Outcome: the record’s dethrone flag reads false. Nothing cleared the bar
Source: the round-one adjudication verdict record. The cross-sectional arm has its own pre-registration, the cross-sectional round-two design document, drafted 2026-07-09 and signed 2026-07-10. The excitation arm’s, pre-registered 2026-07-11 before any training run, is the excitation-features experiment document. Both are preserved with their original hypothesis sections intact and an adjudication header added on top, so the original argument is still readable under the verdict.
2. The four-way tie, to four decimals
Mean P@1%FPR, 793 matched windows.
Variant D, protection mechanism removed: 0.3632
Variant C, pruned inputs: 0.3628
Variant A, incumbent: 0.3624
Variant B, two-head: 0.3603
Per-window logistic control: 0.3506
Source: the round-one adjudication verdict record, its per-arm means block. All four deep arms sit inside the 0.02 tie band; the record carries the tie set explicitly and names Variant D as the winner under the simpler-wins tie-break. The logistic reaches 96.5 percent of the winner’s score.
3. The intervals
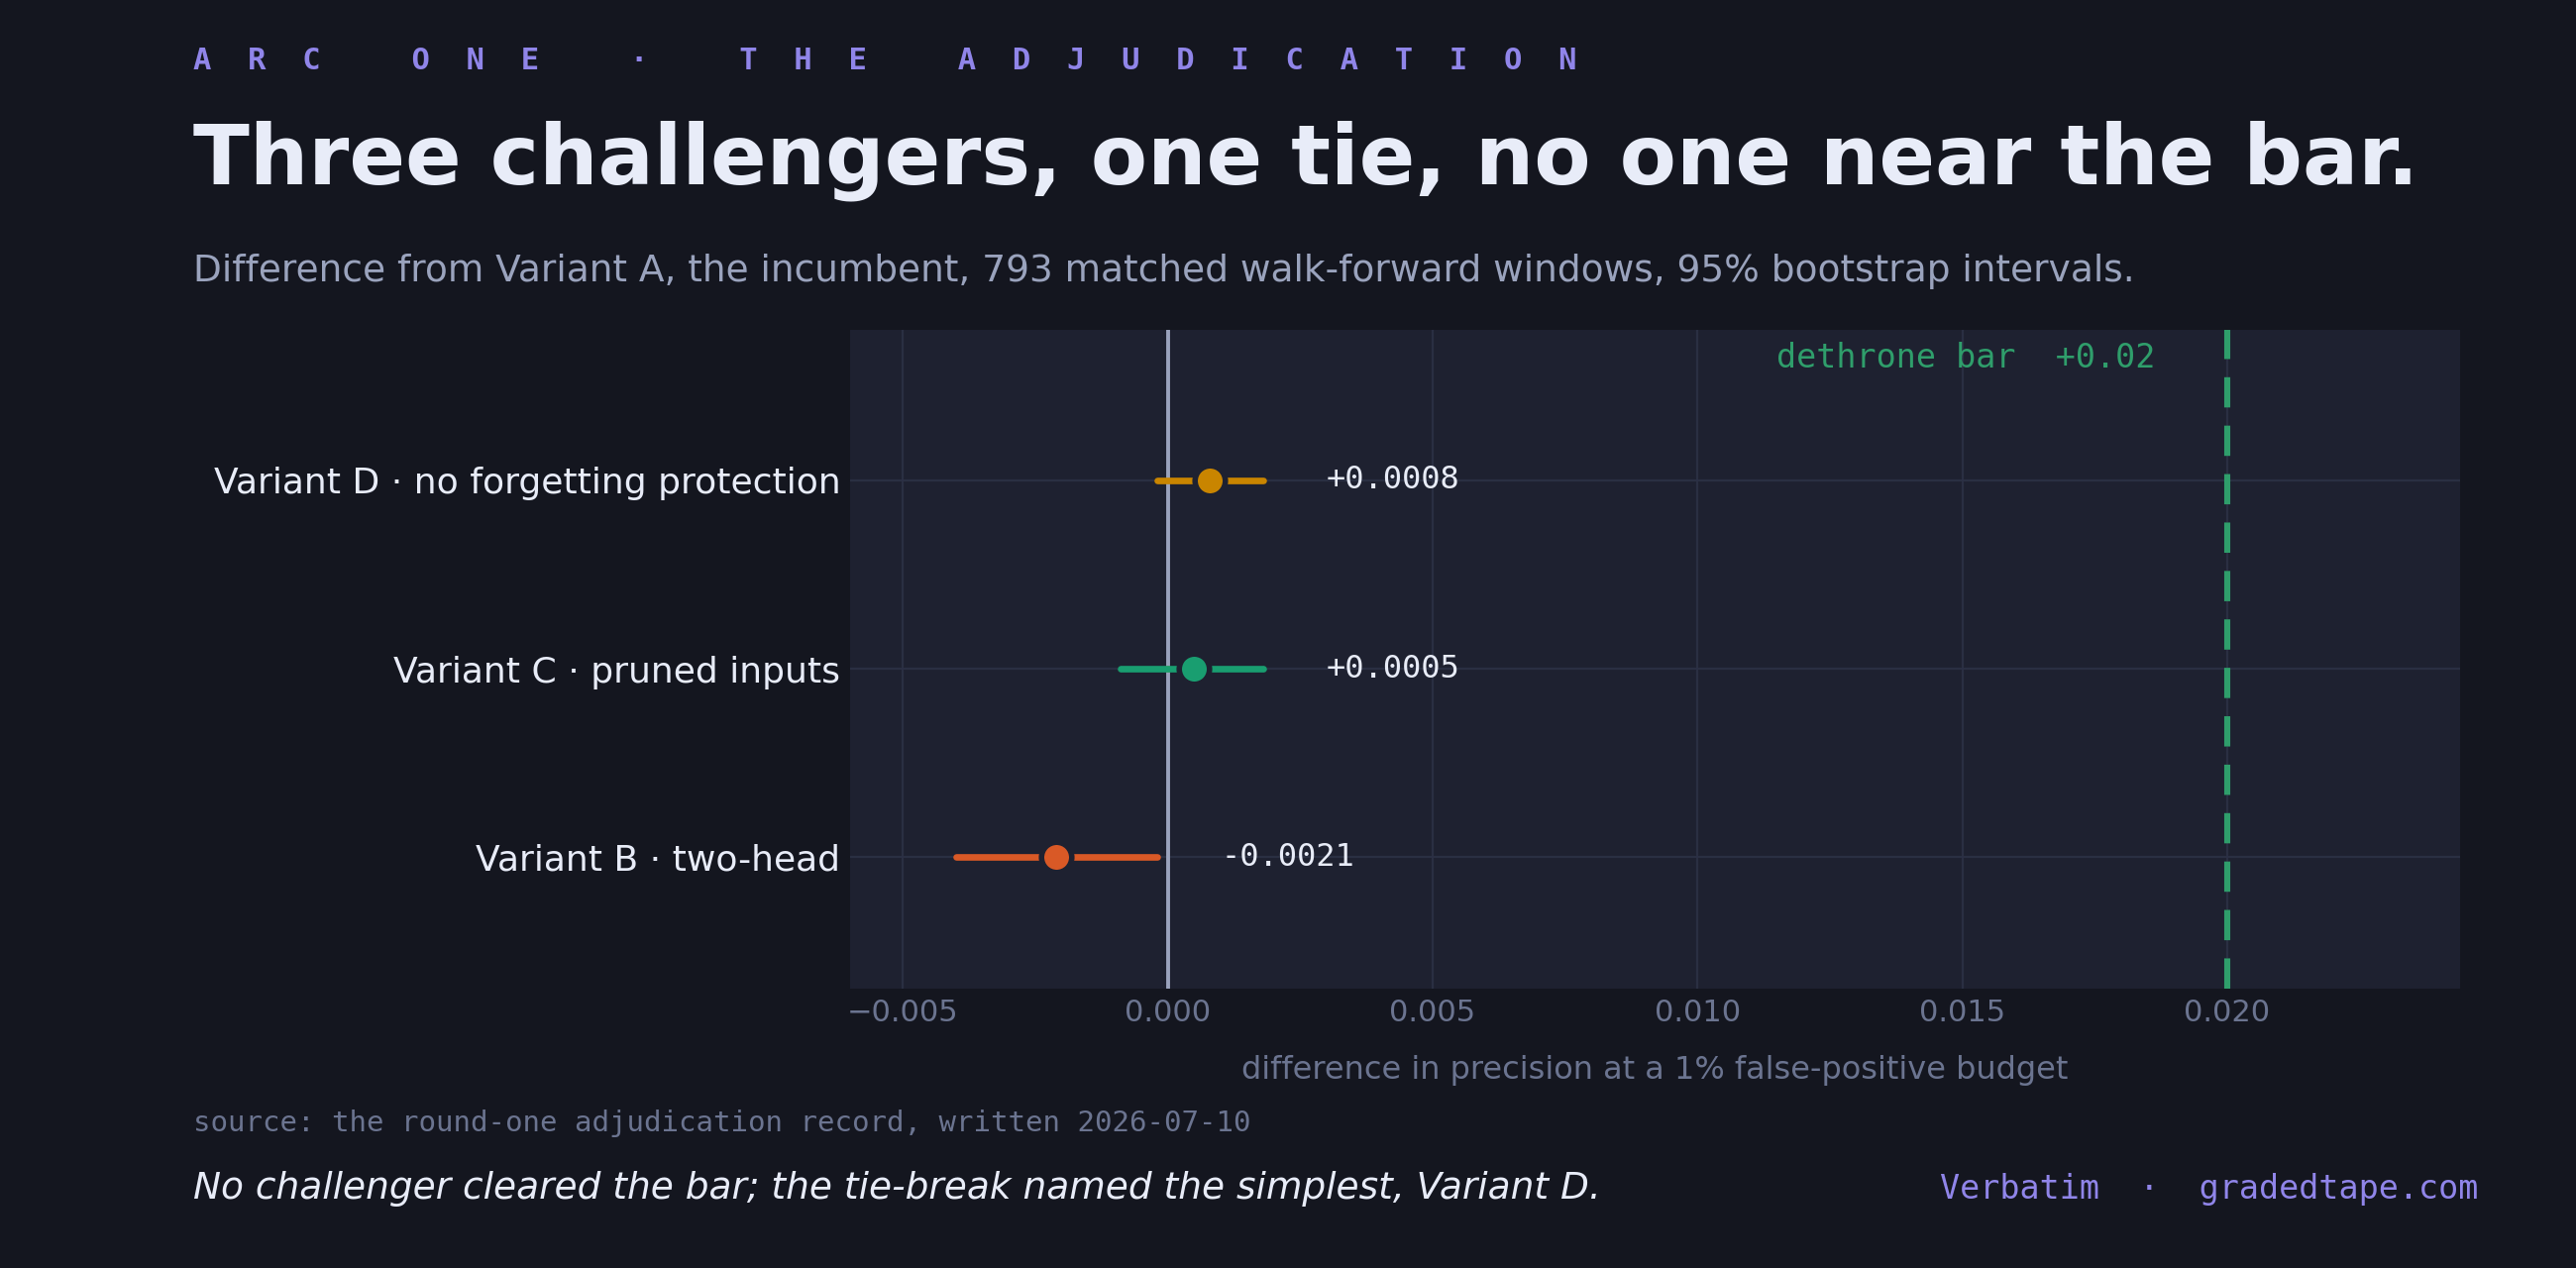
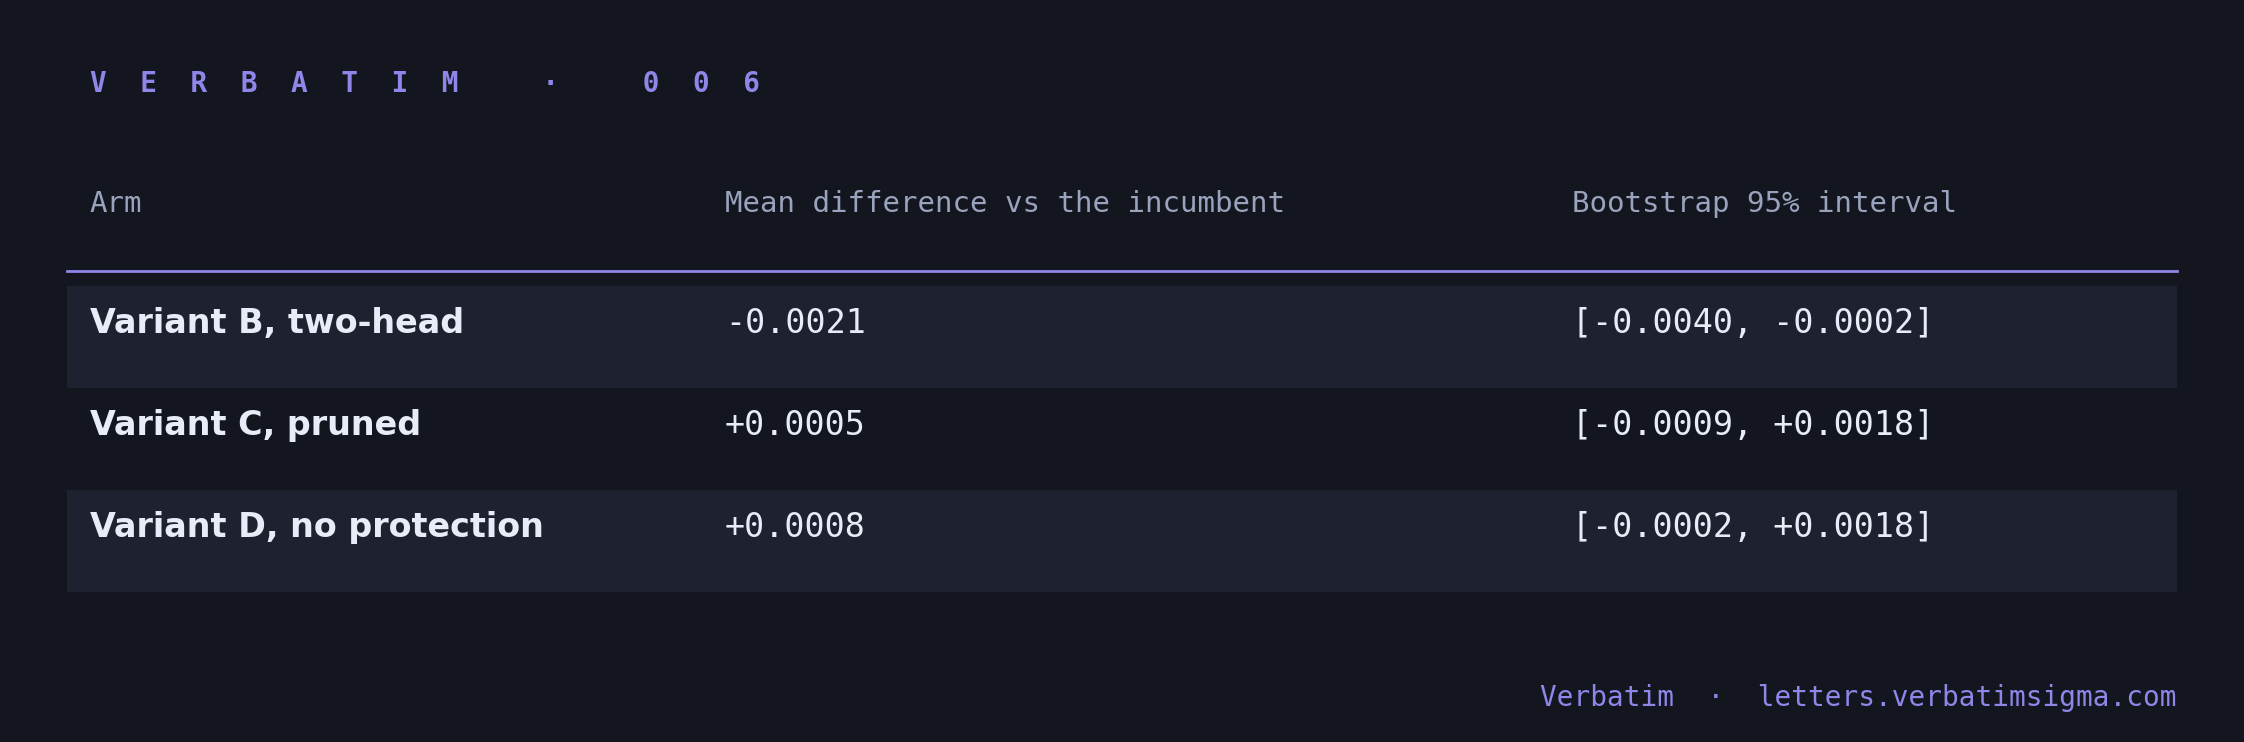
Source: same file, its bootstrap block against Variant A. Look at the first row. The two-head arm’s whole interval sits below zero, so it is reliably a little worse than the model it was meant to beat, and it still belongs in the tie set because the gap is a tenth of the bar.
The one line in that file that cleared its bar is the ensemble. The record’s ensemble line shows +0.0287 with a 95% interval of [+0.0231, +0.0350] against the best single arm, measured on the retained checkpoint grid before the freeze date, with its cost noted as the nightly chains of every member.
4. The worst stretch
Worst rolling ten-window mean.
Variant A, incumbent: 0.2333
Variant D: 0.2612
Variant B: 0.2889
Variant C: 0.2946
Source: same file, its worst-rolling-stretch block. The champion’s worst ten consecutive windows average 0.2333, roughly 36 percent below its full-period 0.3624. This is the closest thing a ranking model has to a drawdown, and it’s the first number I’d look for if someone handed me this table.
5. Premium over the logistic, year by year
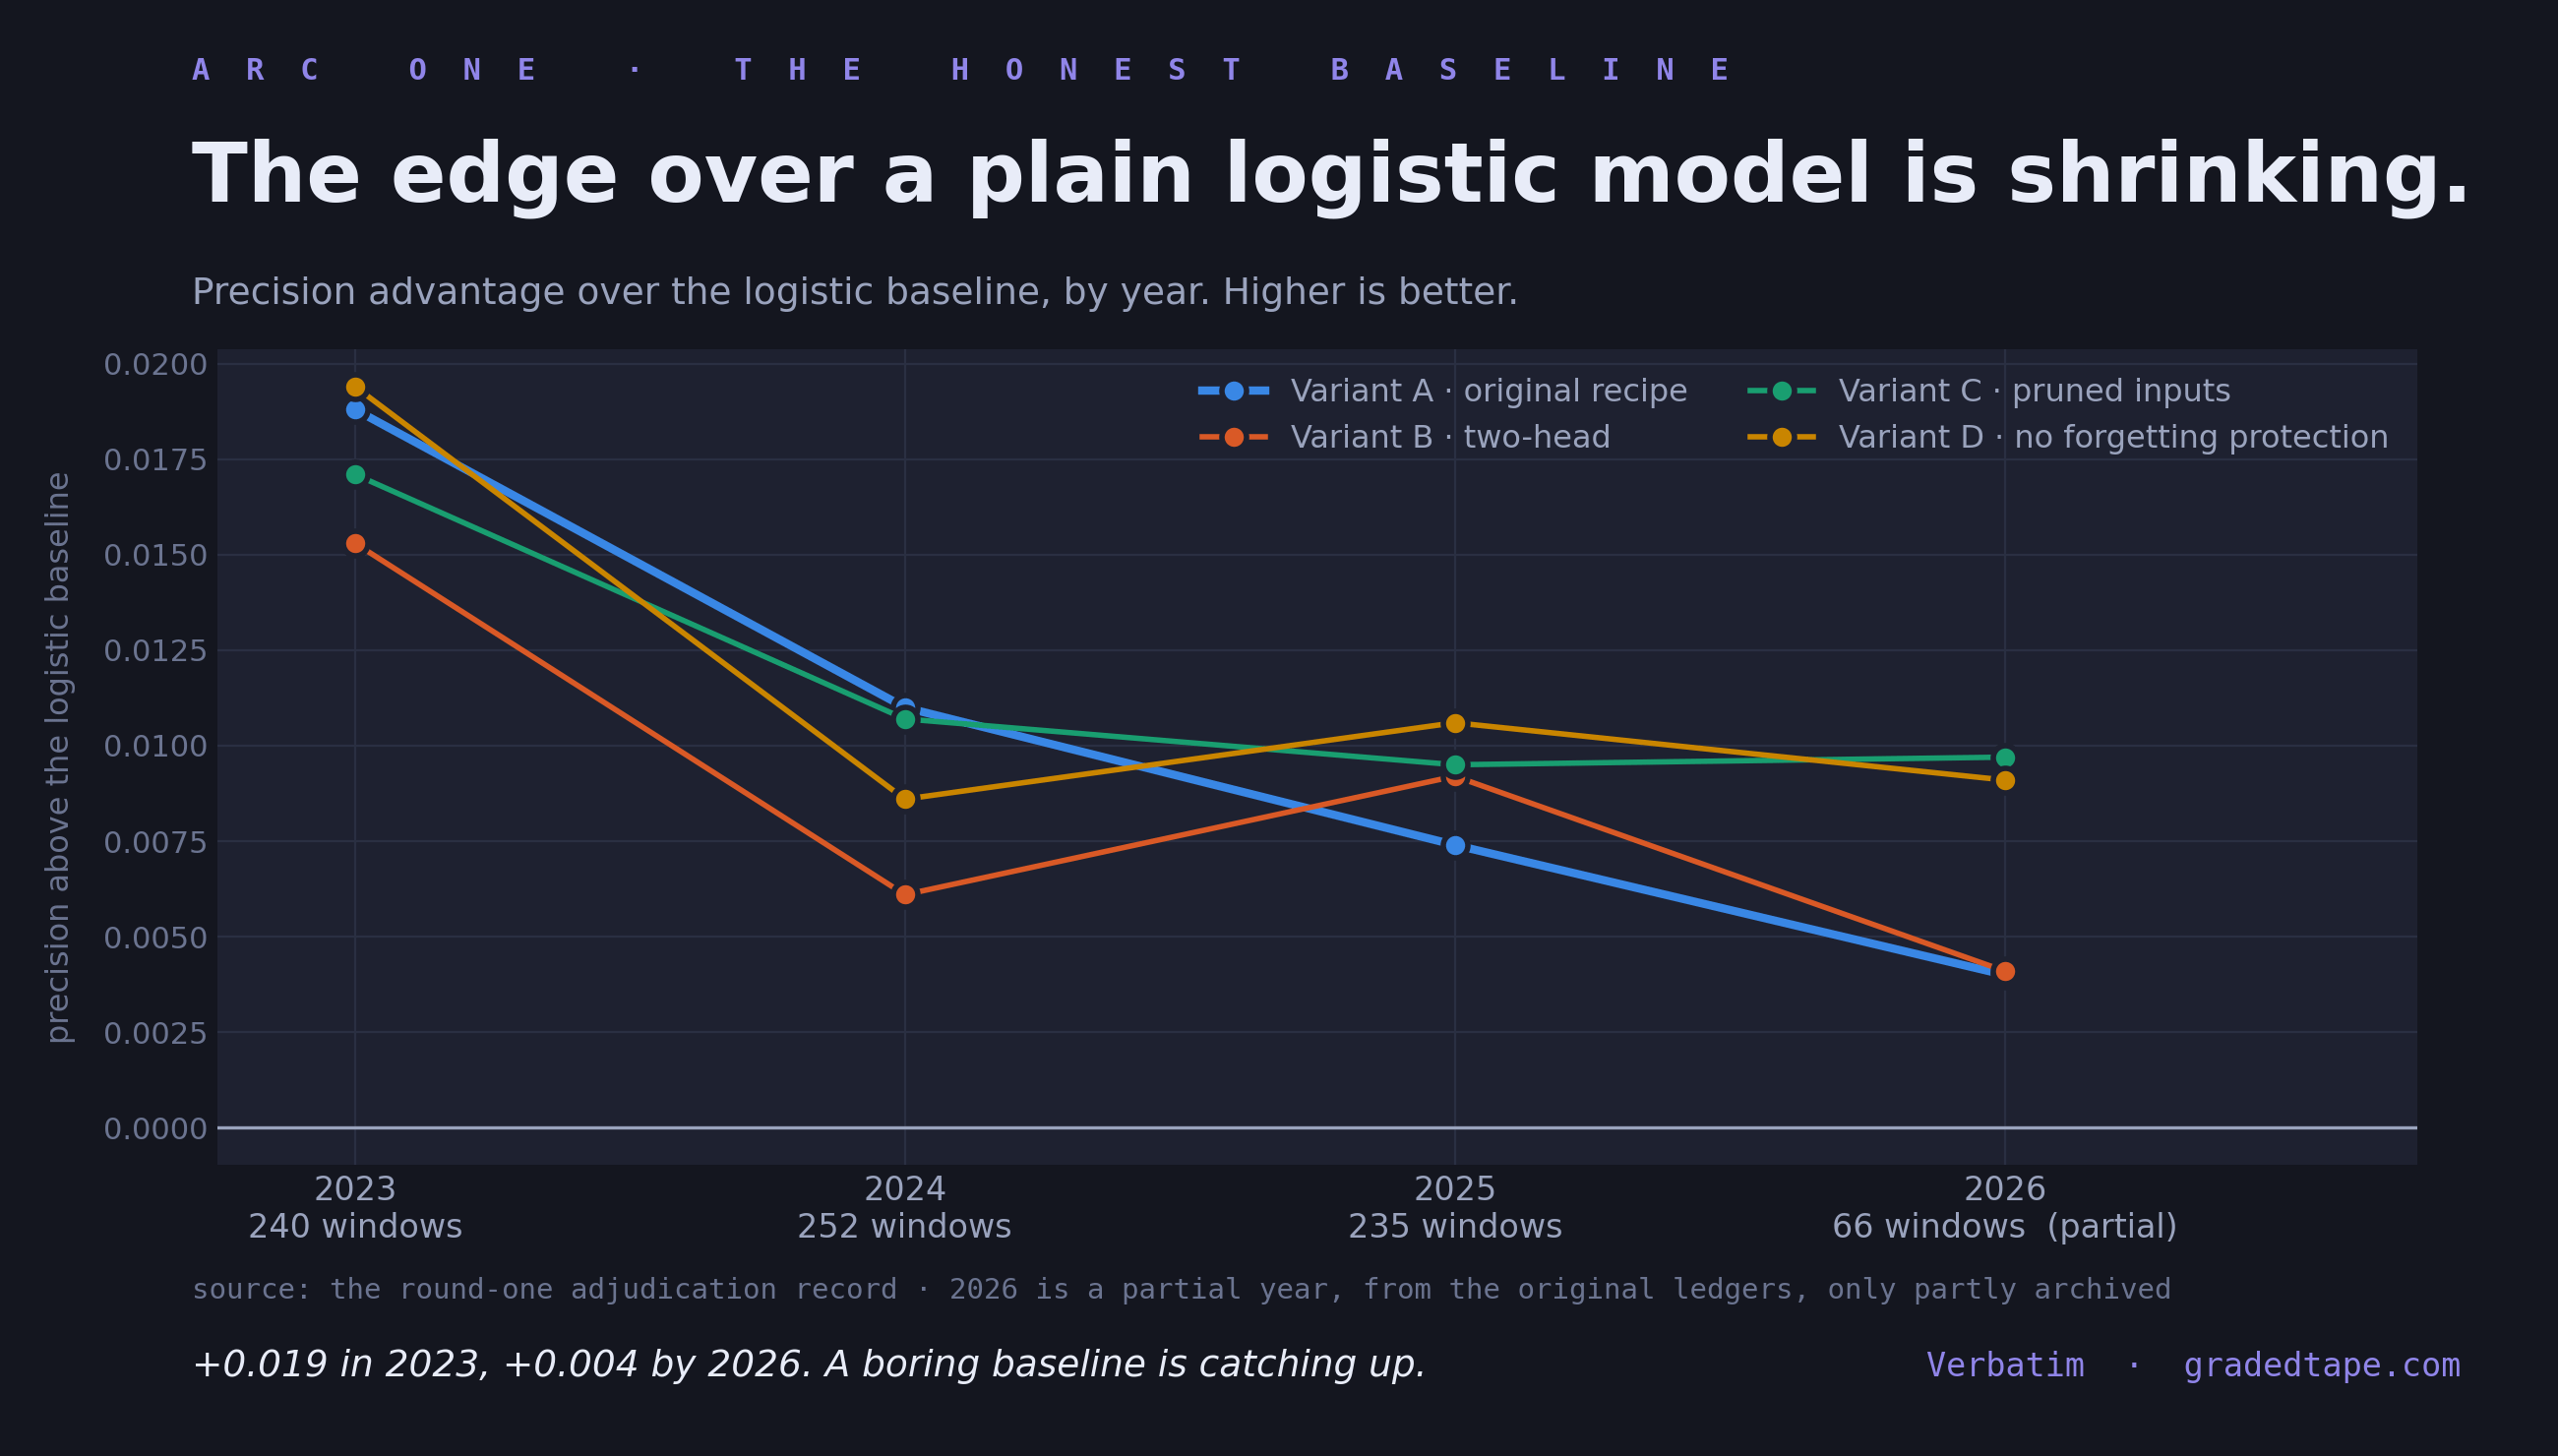
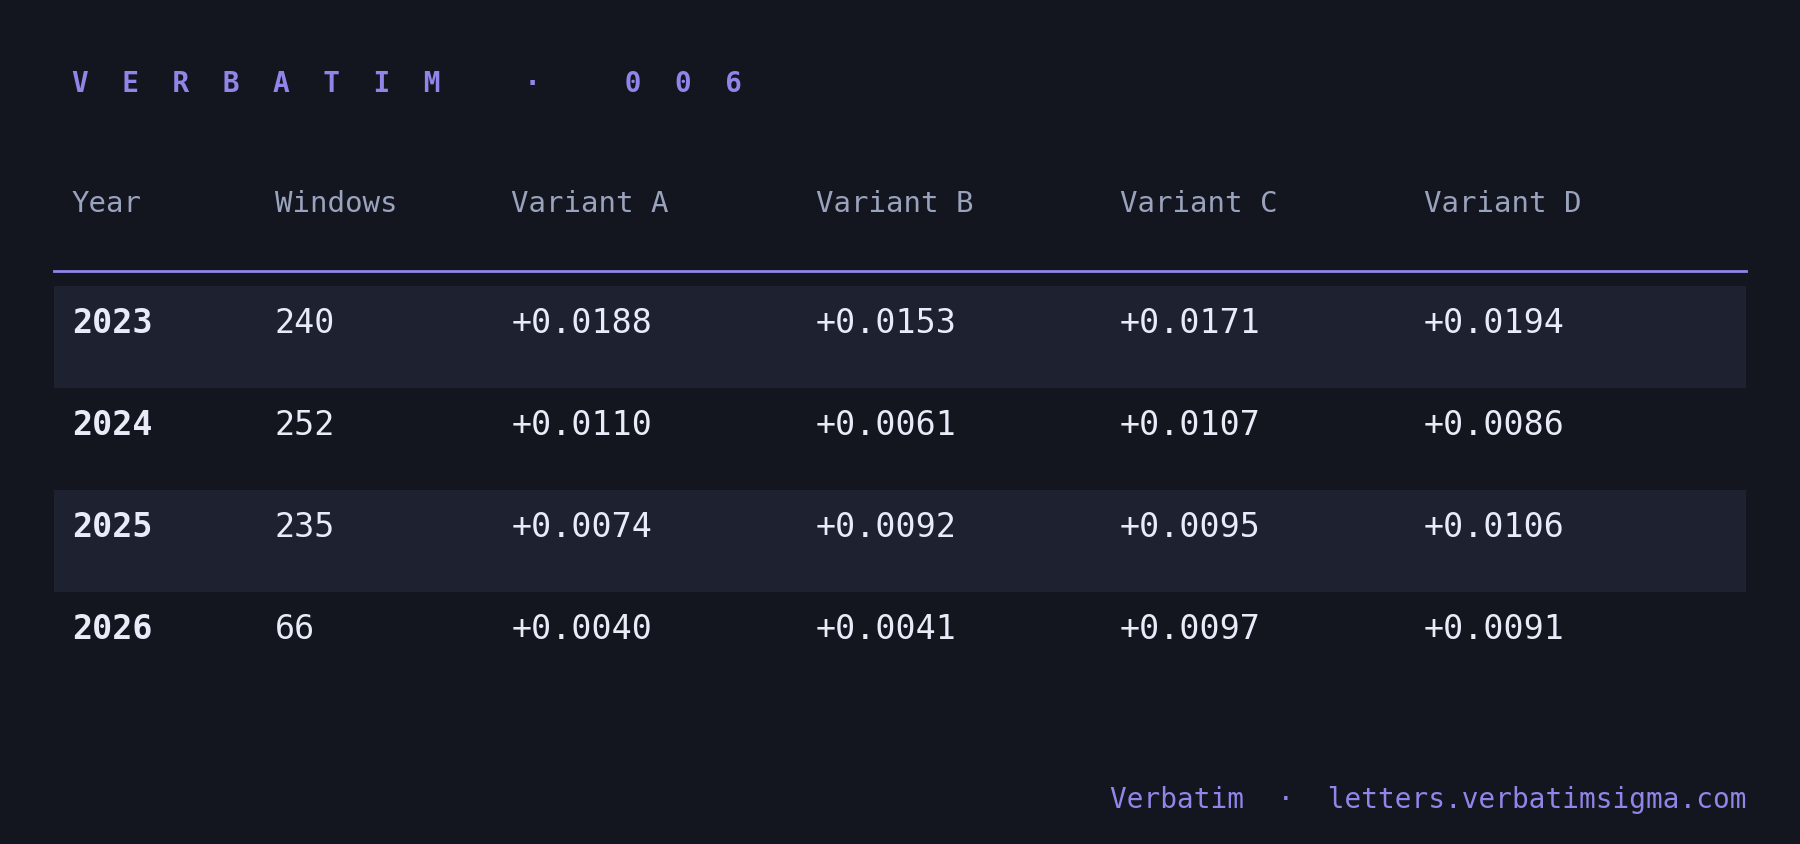
Source: same file, the per-year premium block and the windows-per-year count beside it. The incumbent’s advantage over a logistic regression falls in every year of the record, from +0.0188 in 2023 to +0.0040 in 2026, and 2026 is a partial year of 66 windows, so the last row is thin. The other three arms hold up better in this table, and I wouldn’t push the interpretation further than the table supports (the recomputation caveat at the end of this appendix applies to this row). It is still the row that most argues against paying for a deep model, and it’s why the logistic control retrains forever.
6. The thesis that lost, as filed
The cross-sectional round-two design document carries a status header marking it adjudicated and superseded as a live design, with the sections below it preserved as the pre-registration record. The verdict line says it loses to the champion on matched population, -0.0059 with an interval of [-0.0086, -0.0032] over 71 windows, and gets no further funding. That header sits on top of the document that argued for the idea in the first place, so the argument and the result live on the same page.
7. The near miss that stayed out
The excitation-arm adjudication verdict record covers the excitation-state features.
Challenger mean: 0.3636
Incumbent mean: 0.3624
Mean difference: +0.0012
95% interval: [0.0000, +0.0024]
Windows: 792 matched, 61 frozen excluded
Bar: more than +0.02
Adopted: false
The same file sets its uniform-edge flag to true and carries a reading protocol committed in advance, which says a uniform edge over every member is a possible artifact and should be read skeptically. Its per-year block shows the largest effect in 2026 at +0.0054 over 66 windows, which is the shape a small artifact would take, and why the skeptical reading was committed in advance. One row is marked unavailable. The logistic comparison could not be made for this replay, because the replay was run without baselines.
8. What it cost
Amount.
Capacity and ablation variants (four questions, one shared walk): $60
Rank-aware loss: $50
Cross-sectional attention: $180
Annual normalization refresh: $40
Ensemble, inference only: $15
Excitation features: $50
Itemised subtotal (per-question splits are estimates): $395
Shared machine time and failed runs, belonging to no single question: $28.12
Total, verified against invoices: $423.12
Rented on two single-GPU machines, at $6.14 an hour on the first, then $4.29 an hour after I moved to Lambda Labs, a more cost-effective host for the same kind of card. Storage and platform subscription fees are excluded, since they carry the whole lab rather than this campaign. The $180 bought the news that my founding thesis was wrong; the $15 bought the campaign’s only win.
9. The crash logs
Seven preserved crash evidence logs are kept in the final box archive.
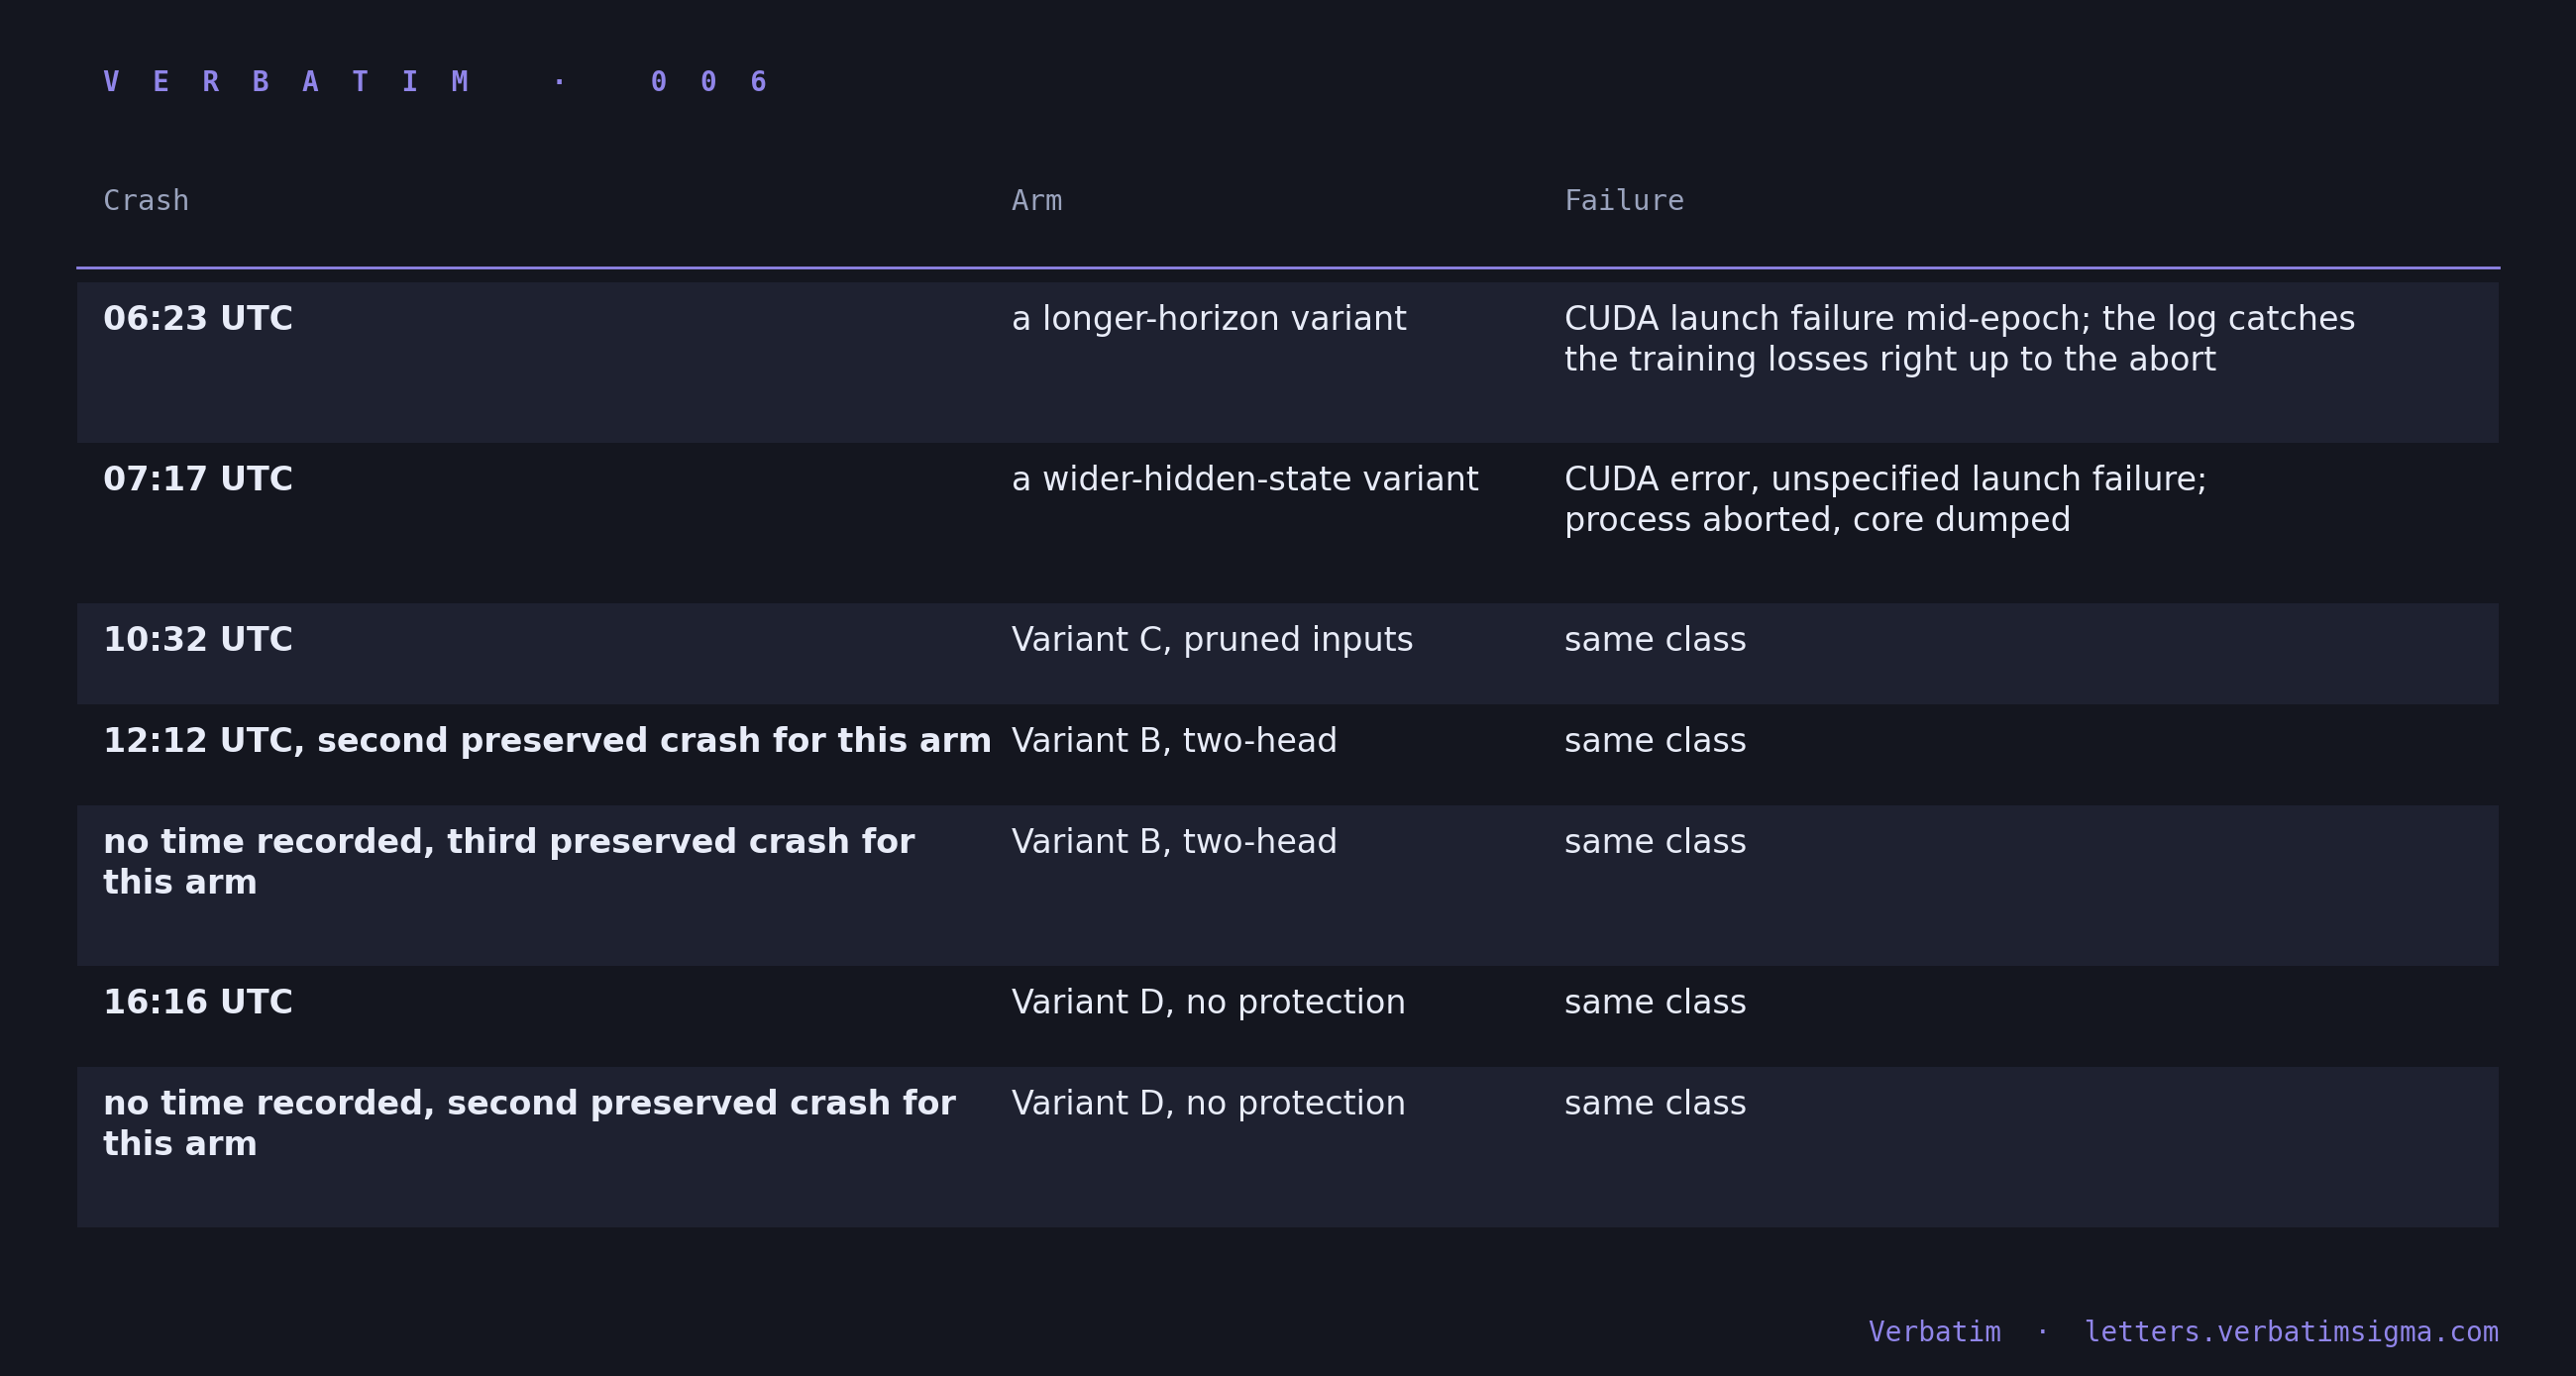
All seven are the same failure, a CUDA launch failure, surfacing partway through a walk and taking the run with it. Five separate training arms were hit. The numbering carries its own footnote. The archive holds a second and a third crash for one arm and a second for another, with no first crash log kept for either, so at least one further failure happened whose log did not make it into the archive. Rented GPUs fail more often than the pricing page suggests, and the campaign included several hours spent restarting from checkpoints.
10. The raw ledgers
The final box archive holds one JSON line per walk-forward window, per arm.
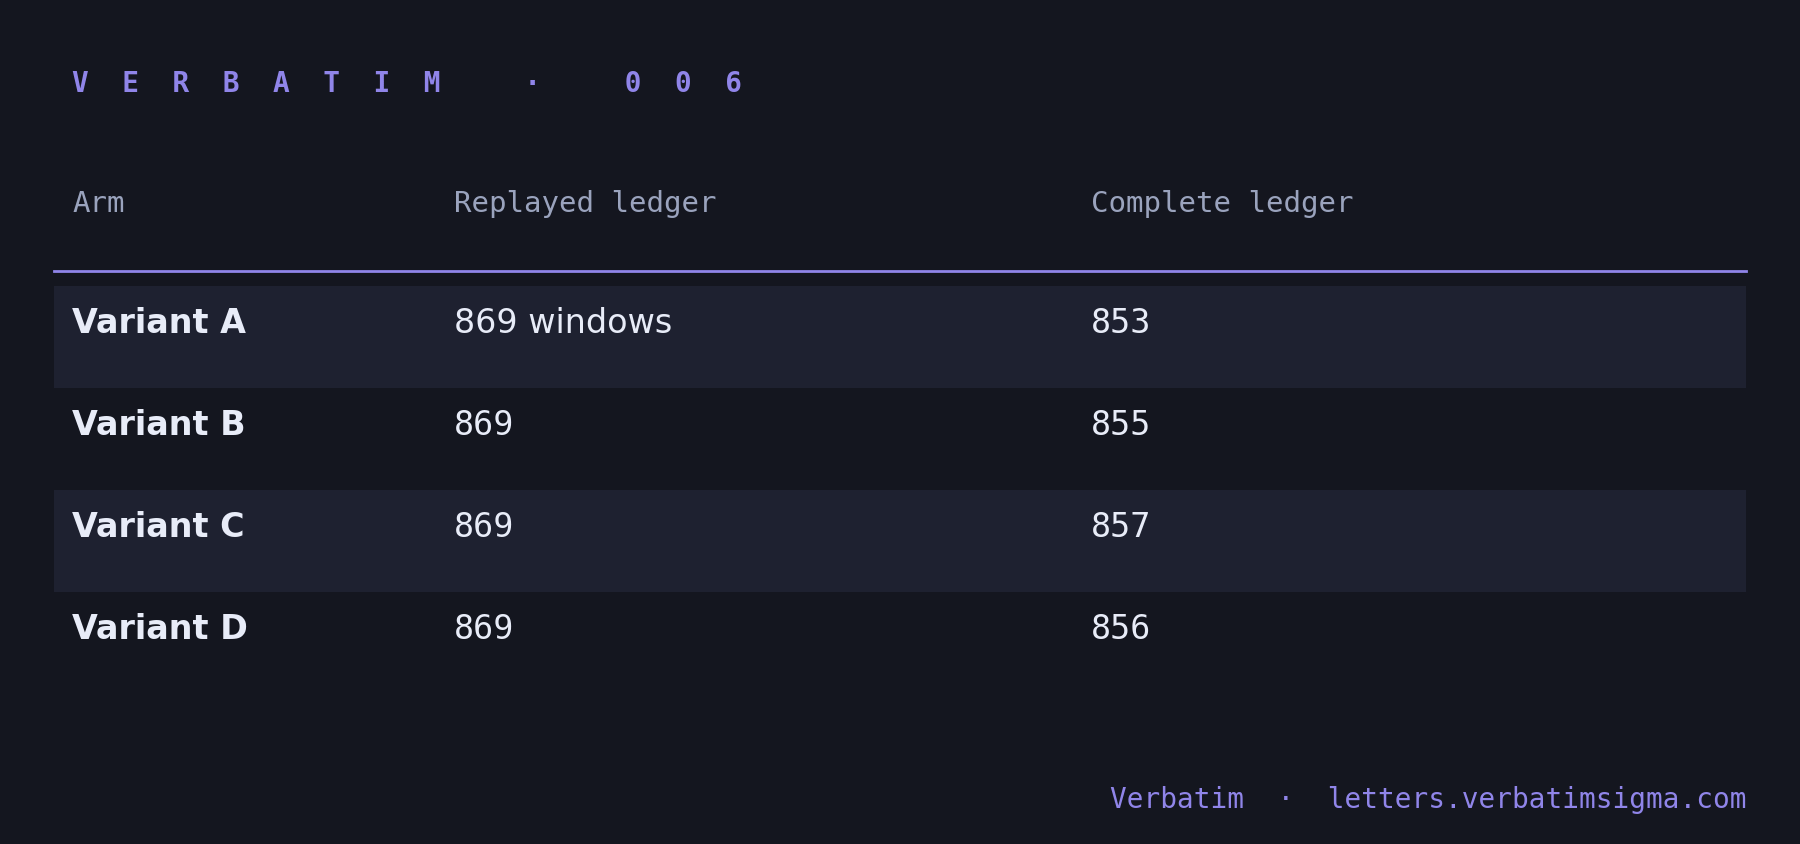
Matched by test date, the four complete ledgers share 838 windows; 45 of those touch the freeze, which leaves the 793 adjudication reports. Each line carries the window’s train, validation and test dates, the run’s configuration and the scores at every horizon. The champion’s ledger also carries the baselines scored on the same window; the other three arms ran without them.
One caveat for anyone who does recompute. The window filter moves the fourth decimal. Score every pre-freeze row in the champion’s ledger instead of the matched 793 and it comes out at 0.3621 rather than 0.3624. The worst-ten column and the 2023 and 2024 premium rows fall straight out of the archived files. The challengers’ 2025 premium cells land within about a thousandth of the printed values. The 2026 row comes from the original adjudication ledgers, which this archive does not fully preserve. Only 9 of its 66 windows here carry a baseline, and on those nine all four premiums come out negative. If you find a number here that you cannot reproduce, tell me, and either the appendix or the verdict gets a correction with your name on it.
Lab notebook, education and research purposes only. Not investment advice, not a solicitation; no advisory relationship is created by reading this. I trade a small account and describe my own process, errors included.
Free subscribers get the build notes below, covering why this breakdown cost almost nothing to make, and the three numbers to print for any slice.