


Written in July 2026. Anything that has changed since then is marked with an October update.
One core belief I had going into this project was that any model looking at one stock at a time misses too much.
Markets move together. Sectors surge, money rotates, panic spreads from name to name, and it seemed obvious to me that a model able to see the whole cross-section of the market at once would beat one that studies each name in isolation.
I believed it enough to design the whole program around proving it. Lookout, the per-stock neural network ensemble I built first, was in my mind just the baseline my real idea would someday beat.
Last week my real idea was tested, and it failed.
The test I could not argue with
There’s an easy way to lie to yourself when testing your favorite idea. Build it, run it, and when it loses, decide the test was unfair. Wrong data, wrong period, needed more tuning, surely worth one more attempt…right?
Every retry is another chance to win by luck, though. Retry enough and one wins, and you’ll be tempted to call it a discovery.
I needed to keep myself from fooling myself, so I locked the following controls before the result existed, in four clauses:
Same windows. Both models evaluated on the identical walk-forward test windows, 71 matched periods in all.
Same population. The cross-sectional model trades a particular slice of the market, so the incumbent was re-scored on exactly that slice.
Same bar as every other idea. Beat the incumbent by +0.02 with a bootstrap confidence interval clear of zero.
Ties go to the incumbent. New ideas carry the burden of proof.
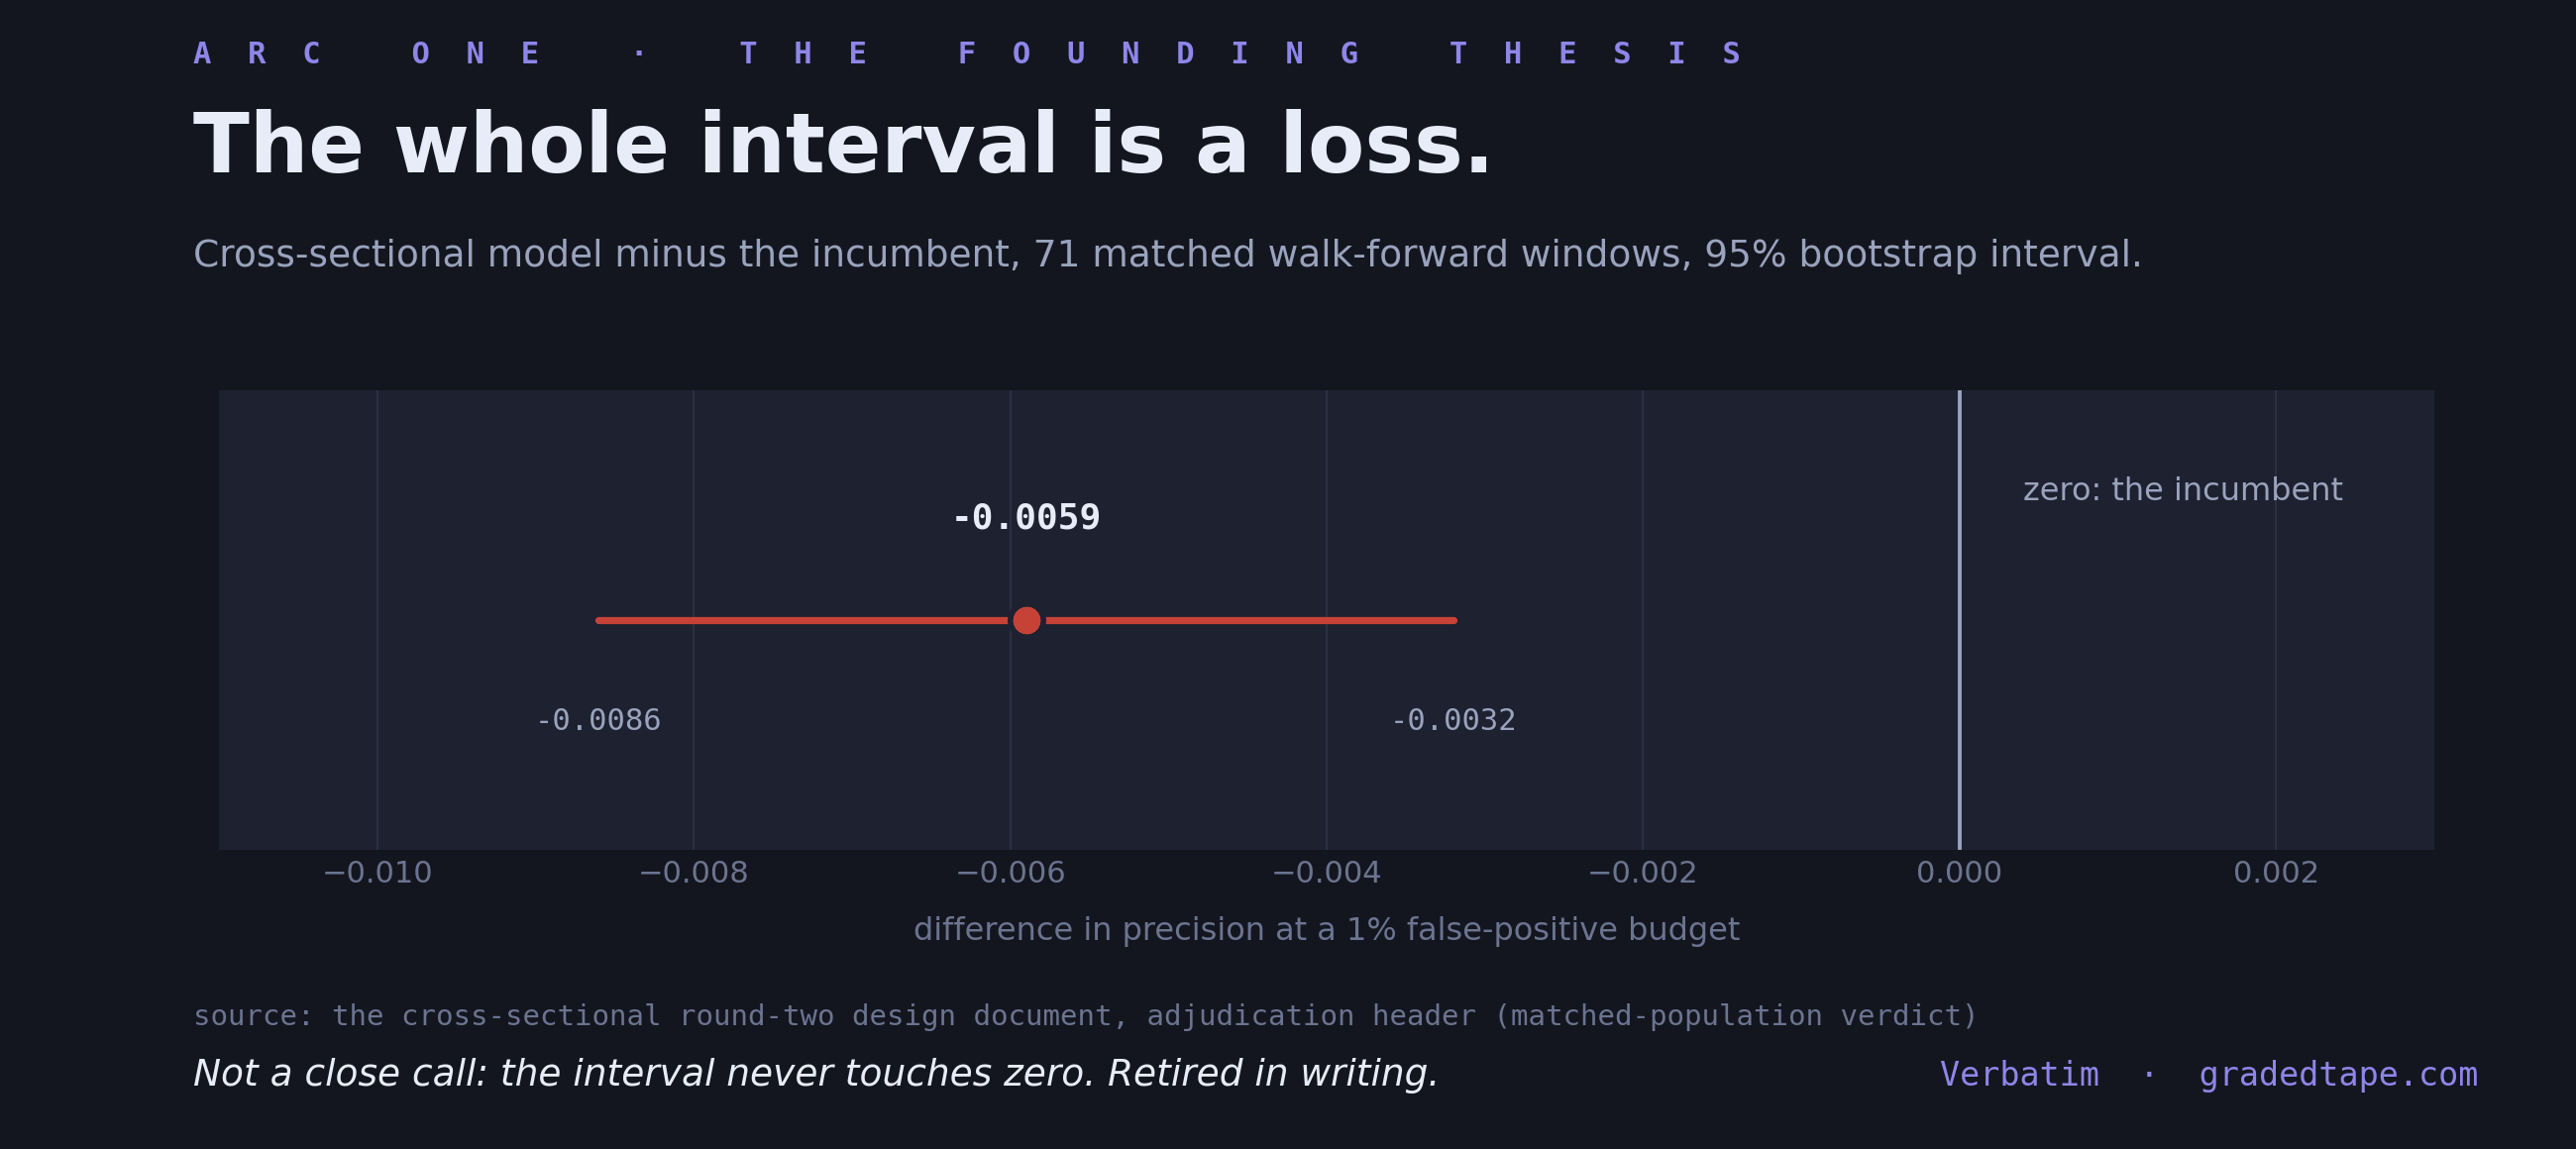
Look at the confidence interval: the whole of it sits below zero. If it had straddled zero, I could have told myself a story about noise and bad luck on a few windows. Instead the market-aware model was reliably a little worse than the model it was supposed to beat, across 71 test windows from October 2023 into January 2024.
Why it lost
I only partly know why. Two observations held up when I checked them.
First, Lookout already saw more of the market than I’d assumed. Several of its feature inputs already carry market context, so the cross-sectional architecture was partly re-learning things the incumbent already knew, while being much harder to train.
Second, sharing information across thousands of names also shares their noise, and minute-by-minute stock data carries a lot more noise than signal.
The exit
The controls I set were pre-registered rules that left nothing for me to negotiate. The idea was retired in writing, in the design doc, with its numbers attached, to prevent myself from quietly bringing it back after a bad month and give it one more try.
Losing was also useful. Working out why it lost showed where my incumbent is most precise, and that was worth more than the thesis it replaced.
Retiring the expensive idea freed the budget for a modest one, averaging my four nearly-tied model variants, which delivered the campaign’s only clean win at almost no production cost. The cross-sectional machinery didn’t go to waste either. The code, the market-slice tooling and the evaluation harness are all still in use.
Without the rule, I’d have kept tuning my favorite idea until it looked good, then traded it. Instead I retired it and moved my watchlist toward the stocks where the incumbent is most precise.
October update: that finding held up as a ranking result, but no edge has yet survived trading costs, and live trading has been dormant since August. The arc’s closer and The Graded Tape have the numbers.
Losses get the same detail here as wins. Subscribe and watch the next ones come in.
The next letter is a four-way tie, and the rule that picked the winner.
Lab notebook, education and research purposes only. Not investment advice, not a solicitation; no advisory relationship is created by reading this. I trade a small account and describe my own process, errors included.
Free subscribers get the build notes below, on what it took to build the model that lost and the tool that made the comparison fair.
How I built it
The cross-sectional model took about four hours of agent time to build, on the evening of July 9, in six commits and roughly 1,100 lines including tests. Most of the work was the data path. My loader served one stock’s history at a time, and the new model needed every stock at the same minute in one batch. The agent added an index that groups sequences by the minute they end, and a sampler that hands the model one market snapshot per batch.